Why does server load matter?
High server load is an issue that can affect any website. Some symptoms of high server load include: slow performance, site errors, and sometimes even site down responses. Troubleshooting high server load requires SSH access to the server where your site resides.
What is high server load?
First, you’ll want to find out: is my server’s load high? Server load is relative to the amount of CPU cores on said server. If your server has 4 cores, a load of “4” means you’re utilizing 100% available CPU. So first, you’ll want to find out how many cores your server has.
nproc – This command says to simply print the number of CPU cores. Quick and easy!
$ nproc

8
htop – This command will bring up a live monitor of your server’s resources and active processes. The htop command will show you a lot of information, including the number of cores on your server. The numbered rows are the CPU cores:

Now that we know how many CPU cores are on the server, we can find out: what is the load? There’s a few methods to find out:
uptime – This command will simply print what the current load is, the date and time, and how long the server has gone without rebooting. The numbers after “load average” indicates your server’s load average for the past minute, five minutes, and fifteen minutes respectively.
$ uptime

17:46:44 up 19 days, 15:25, 1 user, load average: 1.19, 1.01, 1.09
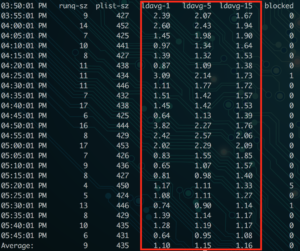
sar -q – This command will not only show you the current load for the last one, five, and fifteen minutes. It will show you the output of this command for every five minutes on the server since the beginning of the day.

htop – Just like finding the number of cores, htop will show you how many of the cores are being utilized (visually), and print the load average for the past one, five, and fifteen minutes.

With just this information, I can see that the server example given does not have high server load. The load average has been between 1-2 today, and my server has 8 cores. So we’re seeing about a 25% max load on this server.
My server’s load is high! What now?
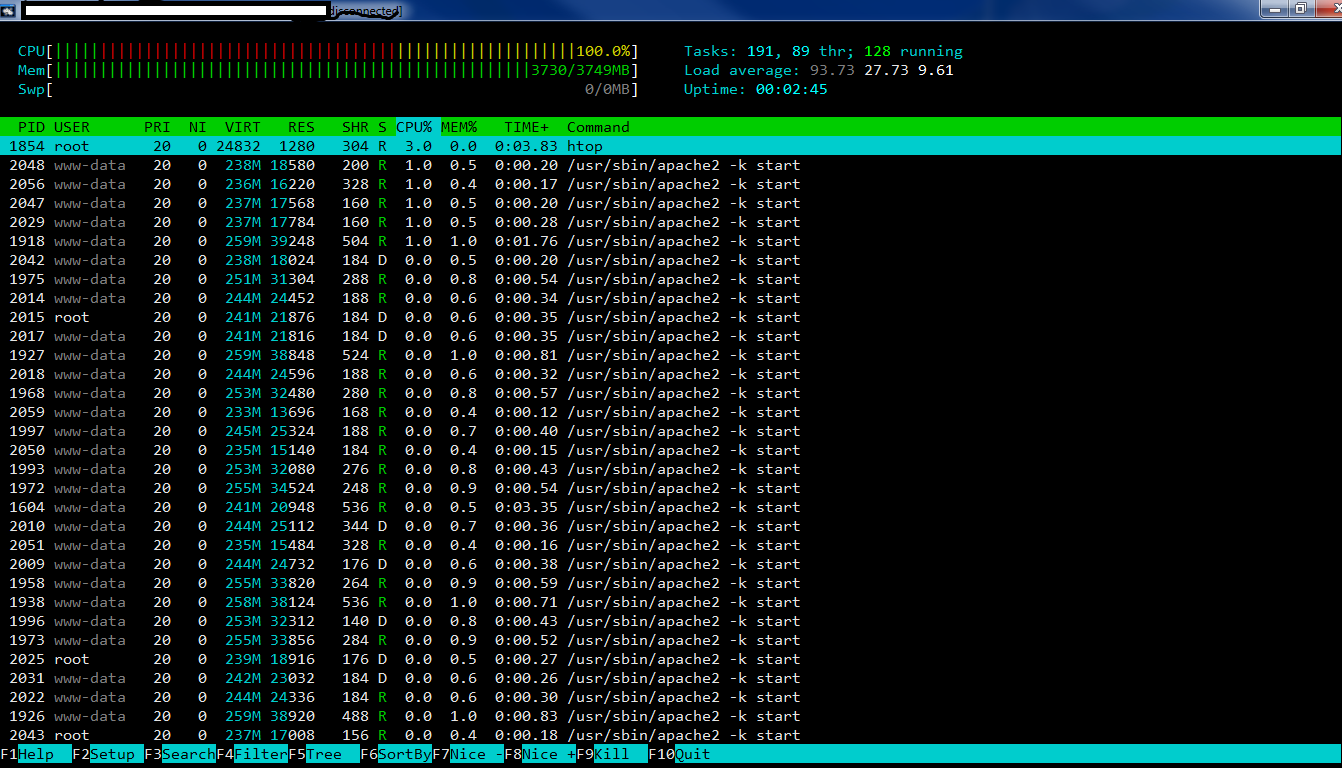
If you’ve used the above steps to identify high CPU load on your server, it’s time to find out why the load is high. The best place to start is again, htop. Look in the output below the number of cores and load average. This will show you the processes on your server, sorted by the percentage of CPU they’re using. Here’s an example:

In this example we can see that there’s a long list of apache threads open! So much so, the server’s load is nearly 100. One of the key traits with Apache is knowing that each concurrent request on your website will open a new Apache thread, which uses more CPU and Memory. You can check out my blog post on Nginx vs Apache for more details on the architecture. In short, this means too many Apache threads are open at once.
So let’s see what’s currently running in Apache!
High load from Apache processes
lynx server-status – When using the Lynx you can see a plain text view of a webpage. This might not sound all that useful, but in the case of server load, there’s a module called mod_status that you can monitor with this. For a full breakdown, check out Tecmint’s overview of apache web server statistics.
lynx http://localhost:6789/server-status

If you’re checking this on your server, be sure to route the request to the port where Apache is running (in my case it’s 6789). Look at the output to see if there are any patterns – are there any of the same kind of request repeated? Is there a specific site or VHost making the most requests?
Once you’ve taken a look at what’s currently running, it’ll give you an idea of how to best search your access logs. Here’s some helpful access-log searching commands if you’re using the standard Apache-formatted logs:
Find the largest access log file for today (identify a site that’s hitting Apache hard):
ls -laSh /var/log/apache2/*.access.log | head -20 | awk '{ print $5,$(NF) }' | sed -e "s_/var/log/apache2/__" -e "s_.access.log__" | column -t
(be sure to change out the path for the real path to your access logs – check out the list of access log locations for more help finding your logs).
Find the top requests to Apache on a specific site (change out the log path with the info from the link above if needed):
cut -d' ' -f7 /var/log/apache2/SITENAME.access.log | sort | uniq -c | sort -rn | head -20
Find the top user-agents hitting your site:
cut -d'"' -f6 /var/log/apache2/SITENAME.apachestyle.log | sort | uniq -c | sort -rn | head -20
Find the top IP addresses hitting your site:
cut -d' ' -f1 /var/log/apache2/SITENAME.apachestyle.log | sort | uniq -c | sort -rn | head -25 | column -t
High load from MySQL
The other most common offender for high load and high Memory usage is MySQL. If sites on your server are running a large number of queries to MySQL at the same time, it could cause high Memory usage on the server. If MySQL uses more Memory than it’s allotted, it will begin to write to swap, which is an I/O process. Eventually, servers will begin to throttle the I/O processes, causing the processes waiting on those queries to stall. This adds even more CPU load, until the server load is destructively high and the server needs to be rebooted. Check out the InnoDB vs MyISAM section of my blog post for more information on this.

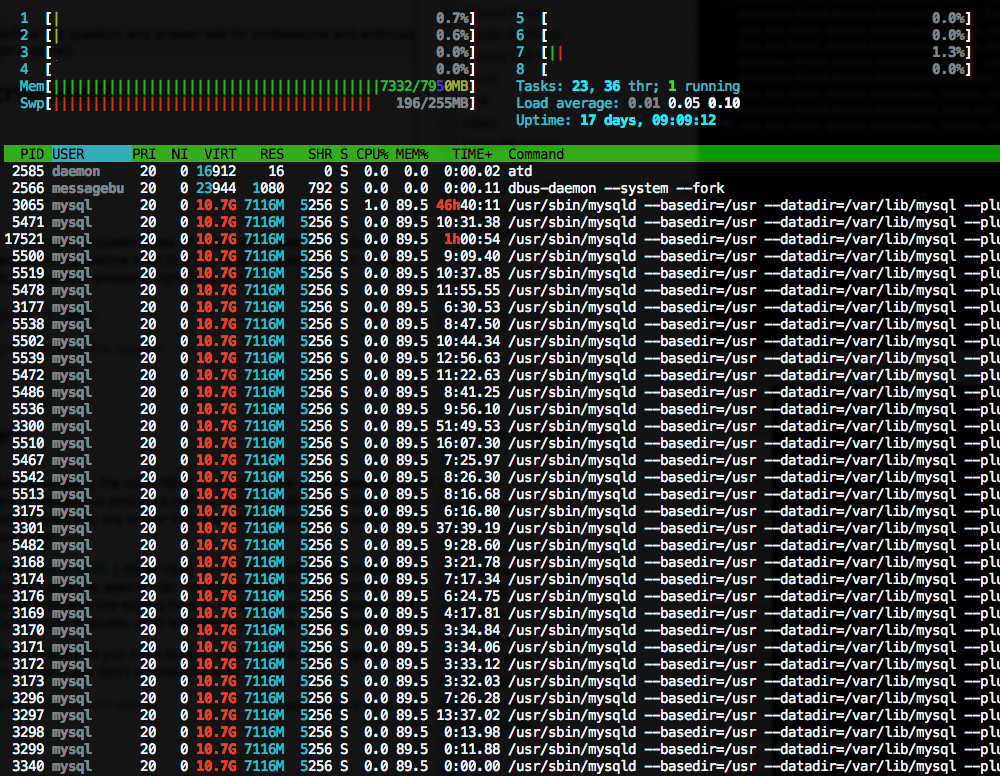
In the above example, you can see the Memory being over utilized by MySQL – the bottom left column at the top indicates swap usage. The server is using so much swap it’s almost maxed out! If you’re running htop and notice the highest user of CPU is a mysql process, it’s time to bring out mytop to monitor the active queries being run.
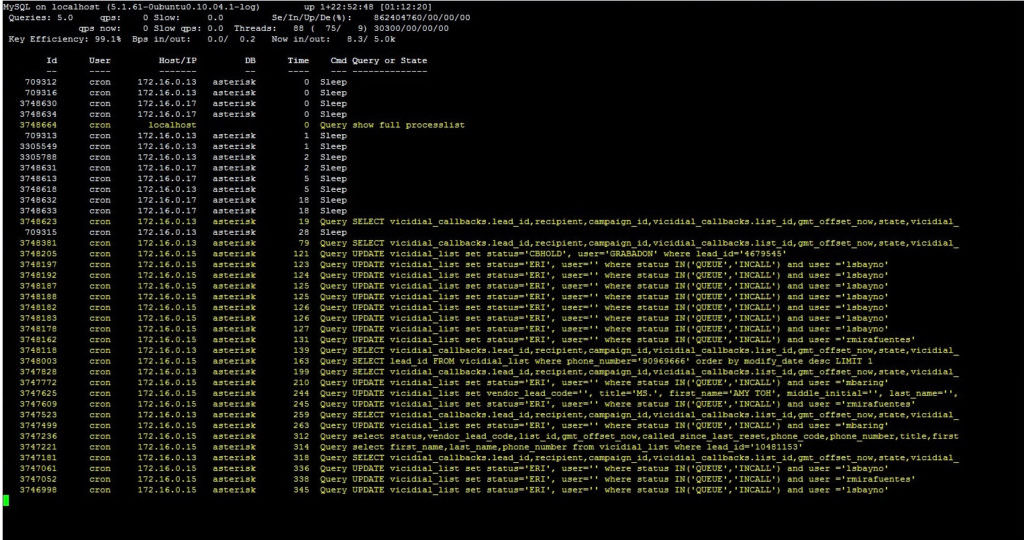
mytop – This is an active query monitor tool. Often times you’ll need to run this command with sudo, for reference. Check out Digital Ocean’s documentation to get mytop up and running.

This can help you track down what queries are slow, and where they’re coming from. Maybe it’s a plugin or theme on your site, or a daily cron job. In the example above, crons were responsible for the long queries to the “asterisk” database.
Other causes of high load
On top of Apache and MySQL, there’s definitely other causes of poor performance. Always start with htop to identify the bad actors causing high load. It might be server-level crons running, sleep-state processes waiting too long to complete, writing to logs, or any number of things. From there you can narrow your search until you’ve identified the cause, so you can work towards a solution!
While there can be many causes of high server load, I hope this article has been helpful to identify a few key ways to troubleshoot the top offenders. Have any input or other advice when troubleshooting high server load? Let me know in the comments, or contact me.
Leave a Reply