• Skip to main content
  • Skip to footer

TechGirlKB

Performance | Scalability | WordPress | Linux | Insights

  • Home
  • Speaking
  • Posts
    • Linux
    • Performance
    • Optimization
    • WordPress
    • Security
    • Scalability
  • About Janna Hilferty
  • Contact Me

Optimization

How To: Ask Google to Recrawl Your Site

What does “crawl” mean?

Before we get started, we should probably clarify: what does it mean when Google crawls your site? Google crawls all pretty much all publicly-accessible websites. This is a search-engine’s process of finding your site’s links and URLs, and indexing them for others to find. Generally, search engines listen to rules you set in your “robots.txt” file. In WordPress, you can allow search engines or discourage them on your Settings > General settings screen. After you’ve launched your site, you’d generally want Google to crawl their site.

What if I don’t want Google to crawl my site?

The one exception is if your site is not public to all web users. It technically is possible for Google to crawl a non-publicly accessible site. This generally happens if a link to that site appears on another site which is publicly accessible. In this case, you can request the URL be removed. Remember, this is temporary. So you still need to update your preferences to tell Google not to crawl at all. In the 90 days between the URL removal and reindexing, you need to be sure to add a noindex header or meta-tag to ensure it’s not indexed going forward.

When would I want Google to recrawl my site?

There are potentially a lot of scenarios when you’d want Google to take another look at the URLs that exist on your site. Some common examples include:

  • You’ve recently rebuilt or restructured your site
  • You’ve added a large number of redirects on your site
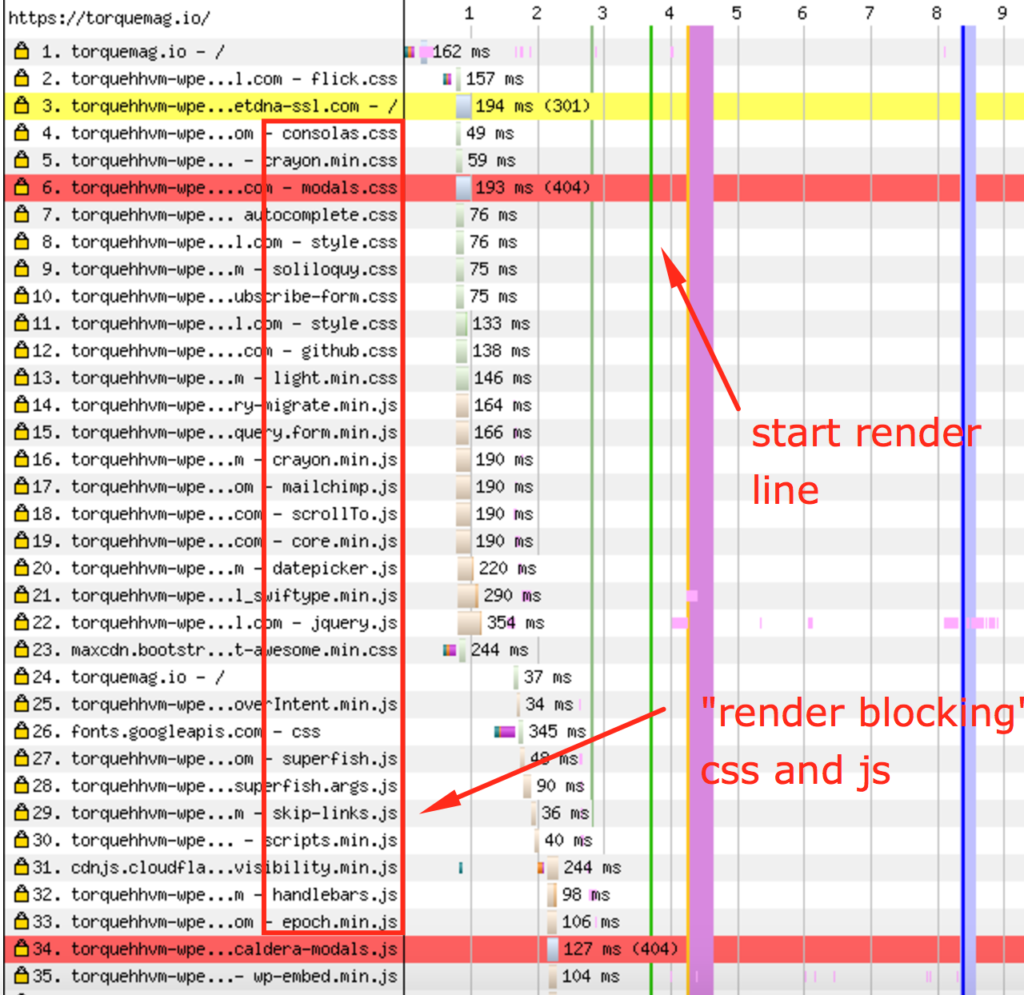
  • You’re seeing a lot of 404s reported in Google’s Webmasters Tools
  • You’ve been hacked or compromised and some bad URLs got indexed
  • Google crawls or indexes links that don’t exist

In these cases, it would be appropriate and advisable to ask Google to recrawl.

How do I ask Google to recrawl my site?

First, I’d recommend updating your sitemap is current, and submitting that to Google. Remember: if you use Yoast SEO, the plugin updates your sitemap as you go. Once you’ve confirmed your sitemap is up to date, be sure to add it to Google (and remove any old ones).

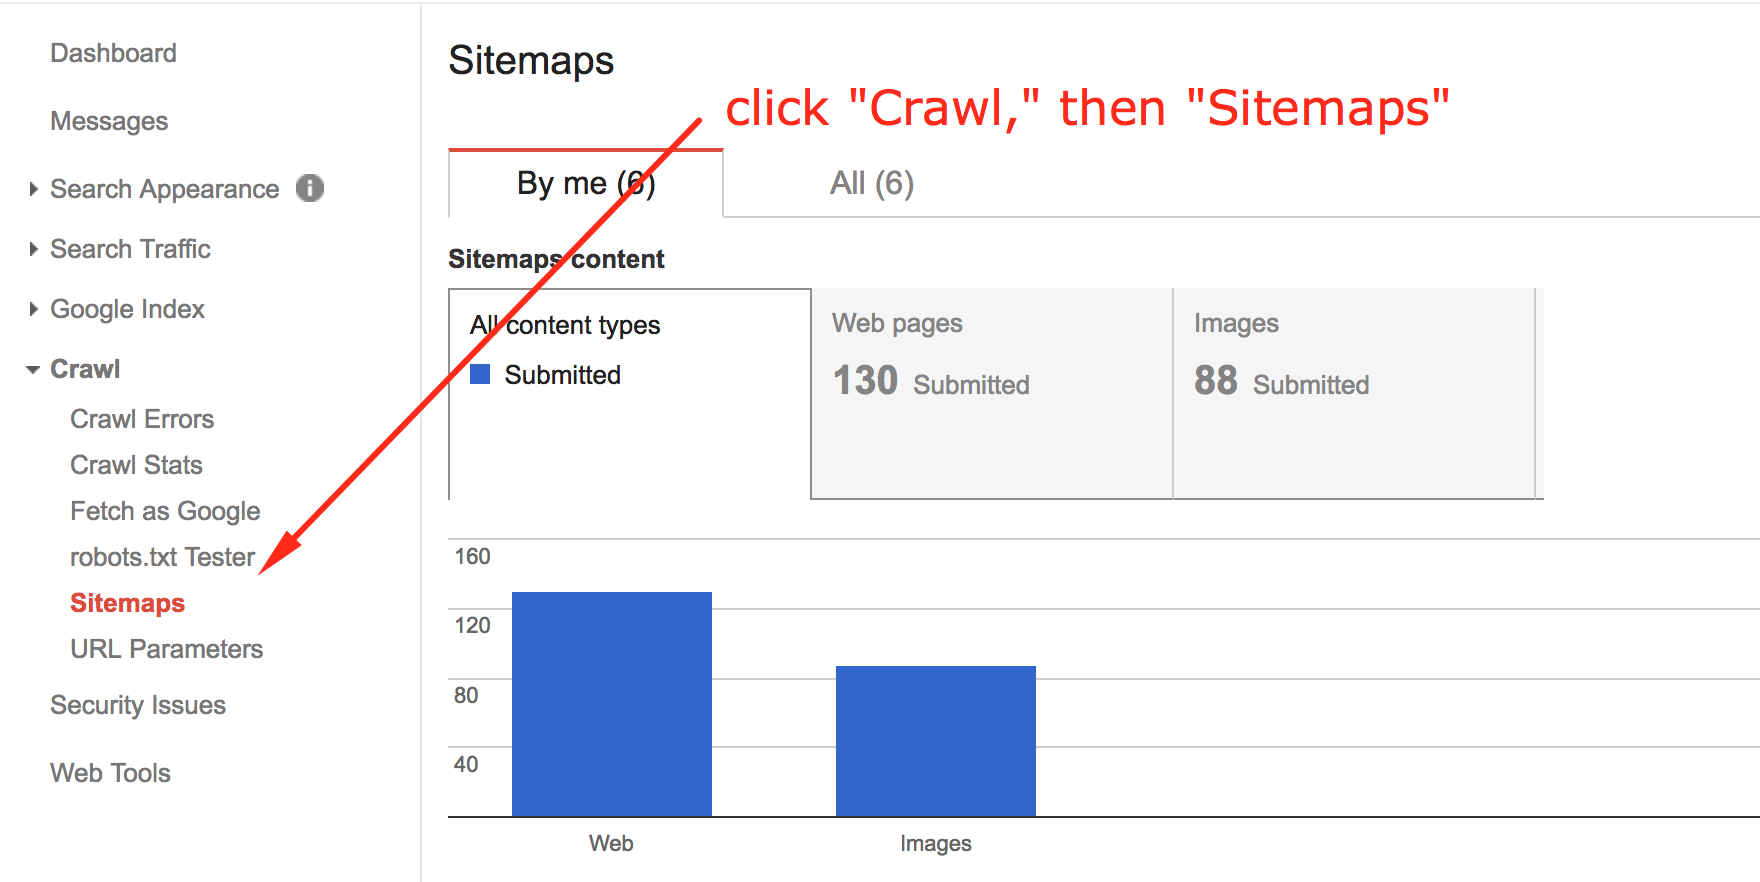
Be sure to click any old sitemaps in the list, and remove them before continuing.

To ask Google to recrawl from here, you can follow these steps:

  1. Go to Google Webmasters Tools and sign in.
  2. Select the site you’d like to recrawl from the list.
  3. Click “Crawl” from the menu on the left.
  4. Click “Fetch as Google.”
  5. Leave the box empty and submit. 
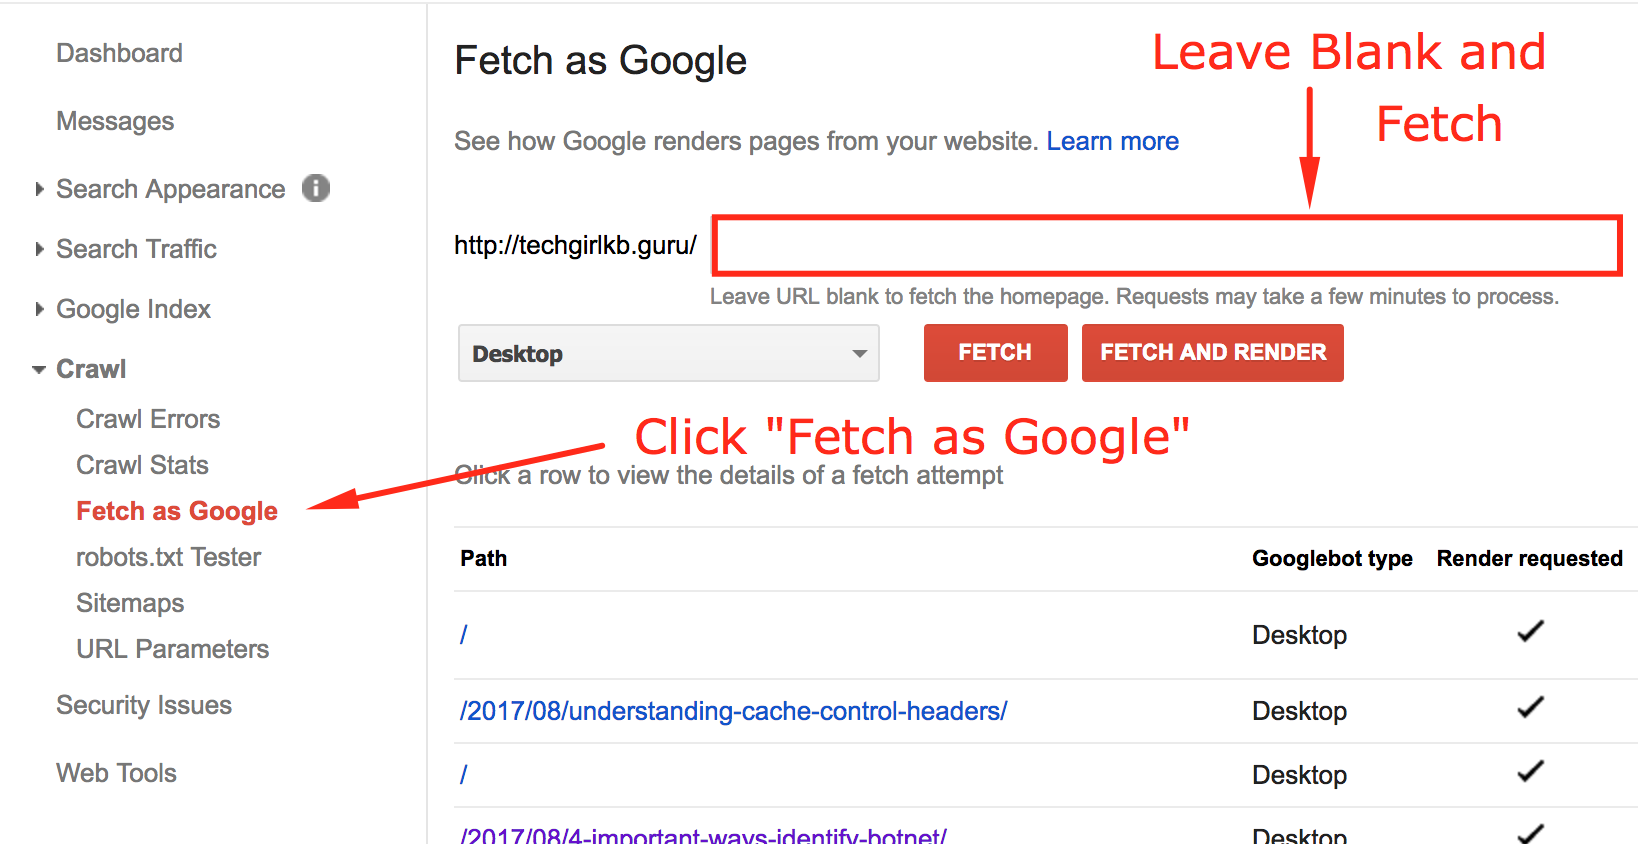
  6. Wait a few seconds as Google fetches and renders your site.
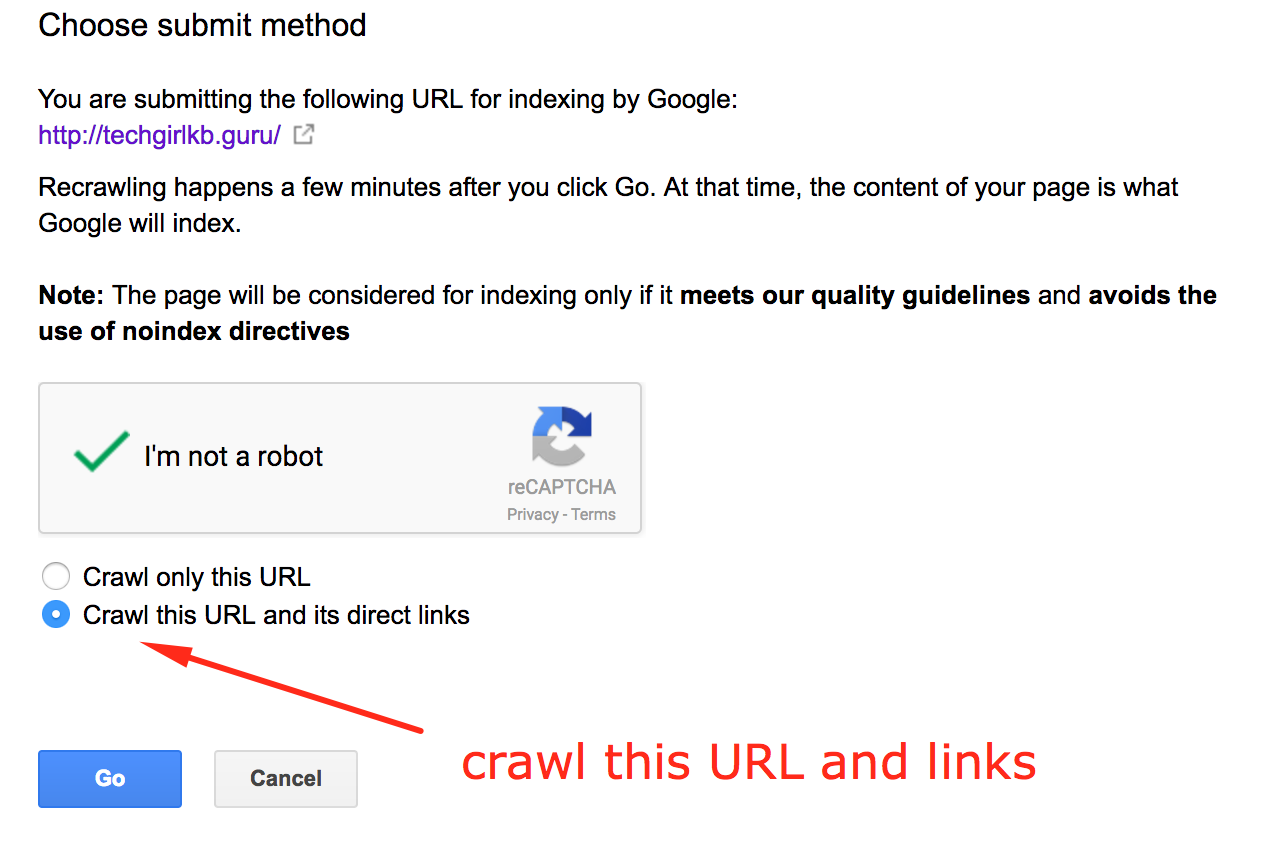
  7. When it finishes fetching, click “Request indexing.”
  8. In the popup window, click “Crawl this URL and its direct links.”
  9. Wait for a few days – Google usually takes several days to recrawl URLs submitted.

After these steps, the search engine results for your site will be more accurate! However, you’ll want to be sure you allow Google several days to do the recrawl.


That’s all, folks! If you’ve followed the above steps, you’ve successfully asked Google to recrawl your site. Future Google crawls should be more successful too, with your updated sitemap. Additionally, you can find instructions for other search engines online.

Have any other thoughts or advice on how to get Google to recrawl your site? Leave me a note in the comments, or contact me. 


Brute Force Attacks and WordPress

Introduction

WordPress is a leading Content Management System used by around 27% of all websites. As its market share grows, more and more attacks target WordPress sites. A common type of attack is called “Brute Force.” In this method, the attacker simply guesses combinations of usernames and passwords repeatedly until they find success. Most often, these attacks are made by bots.

There are some simple ways to avoid penetration by a Brute Force attacker. Prevention is managed at two primary levels: Firewall-level, and WordPress-level.


brute force attacks

Firewall-level prevention

One of the best ways to prevent Brute Force attacks is using a firewall. If you manage multiple sites on the same server, the protection you put in place at this level will protect all your sites. Additionally, if attacks like this can be mitigated at the server-level, this protection won’t have to be processed by PHP/WordPress, which means fewer server resources are being used.

Cloudflare

CloudFlare is a reverse-proxy service. In this scenario you direct your site’s nameservers to point to CloudFlare, and manage the A records or CNAME records from your DNS provider at the CloudFlare level. This option is ideal for a few reasons. First, CloudFlare masks your site’s “Origin IP,” or the IP address of the server where your site’s content is hosted. The IP masking prevents attackers from sending attacks directly to your server and bringing your site down.

On top of the natural benefits of using this service, CloudFlare offers a rate-limiting option. Using “Protect Your Login,” you can configure rules that will block IPs if they have made POST requests to your login page within the last 5 minutes.

The benefit of blocking the IP addresses with CloudFlare is that the attackers don’t even have to touch your site to get denied. So, no server resources on the server where your site is hosted will be used.

Sucuri WAF

Sucuri WAF works similarly to CloudFlare in that it offers protection as a reverse-proxy. Using Sucuri WAF will also mask your site’s origin IP, and block IP addresses before they can reach your origin server. The difference between the two is that Sucuri is a leader in website security. Meaning, their service is geared specifically towards security, protection, and compatibility. Additionally, they offer more configuration options specific to security overall.

HiveWind

HiveWind is a DDOS Mitigation service that sits in front of your site’s server as well, as a Cloud Load Balancer. Their services cover a large number of attacks that might affect your site, and the layer is cloud-based. The HiveWind firewall can automatically detect bad-actors like Brute Force attacks and botnets. The large difference between HiveWind and its competitors is that it cumulatively blocks attacks. That means if an IP has attacked another site, it’s blocked for all users on HiveWind’s service. And unlike many other DDOS services, even the enterprise-level services are flat-rate no matter the scale of the attack.


If you want to try HiveShield DDoS protection on your own server, use the coupon code TCHGRLKB. This coupon code is good for 8 cores/$50 a month OR 16 cores/$100 a month, each with a free 30 day trial – a 50% savings!


Incapsula

Incapsula is a reverse proxy system used as a CDN to sit in front of your origin server. While the setup process can be trying sometimes, the end result is a thoroughly-secured website. Their IncapRules security system uses advanced detection to identify whether the user is a bot, and block sessions. And, what’s unique about Incapsula’s system is that it allows you to configure the protection to be as aggressive as you want. They also offer a resiliency score to test whether your site is ready to handle a DDOS or not.


WordPress-level prevention

If firewall-level protection isn’t possible, you can begin looking at WordPress-level protection. While this kind of protection leaves your server resources more vulnerable, it’s still helpful. The attackers will still be denied. But, making WordPress do the heavy-lifting is more taxing on your server.

Below we’ll cover some common options for your WordPress site. These options are still helpful to block potential brute force attackers on your site.

WordFence

The WordFence security plugin is an easy way to automatically block attackers. Using their settings, you can force users to set strong passwords, lock users out after failed attempts, and automatically ban users who try common usernames. One of the most common usernames is simply “admin.” With this plugin you can block anyone who tries this user. Read their blog post for more information.

Sucuri Security

Using the Sucuri Security plugin you can block Brute Force attacks. And not only this, you can also use their services to scan for malware and actively track file changes. What’s unique about this plugin is the level of logging it offers. Plus, the logging doesn’t go to your local database. It’s stored securely with Sucuri themselves. The Brute Force detection is best when used with their WAF mentioned above.

iThemes Security

The iThemes Security plugin (previously known as Better WP Security) is one of the widest-used security plugins. It offers 30 different ways to secure your site. One of these options includes moving your login page to a different URL. Since many Brute Force attacks rely on the login page being called “wp-login.php,” this alone can defer many attacks. Like HiveWind, iThemes security uses a brute force detection network. So, if one IP is blocked on another site, it’s blocked for yours too.

All-in-One WP Security

The All-in-One WP Security plugin offers a cookie-based detection of bots and brute force attacks. Since bots generally do not load assets like cookies, javascript, or css, this allows them to block bad actors. And, unlike other plugins, this one allows you to block attackers by IP address or user-agent. It also includes a “captcha” which makes the user prove they are human.

Hide Login Plugins

There are a number of plugins which will rewrite your login URL. Some common examples include: WPS Hide Login, Rename WP Login, and Loginizer. A single-function plugin like this is not always the most ideal. For instance, if you use page caching on your site, you’ll need to ensure your new login page is uncached. But, these plugins will deflect some brute force attacks simply because bots won’t know where to login.


WordPress Best Practices

Last, to prevent Brute Force attacks you should follow some simple best practices. This list will help prevent many kinds of attacks.

Don’t use the username “admin.”

This is the most commonly-used username in existence. Since Brute Force attackers need to guess your username and password, using this username gives them half the equation right away. Be smart! Choose a more unique username.

Use a captcha.

Captchas are usually image or math-based forms for testing whether a user is a human or not. Since most brute force attacks come from bots, this simple trick will prevent most attackers.

Use 2-factor authentication.

This method means a bot would have to guess two sets of authentication, one of which is constantly changing. Google Authenticator is one of the most common options. Be sure to install the app on your phone as well! This is how the system works for authentication.

Require strong passwords.

For any high-level user on your site (like an Author or Administrator) you should require they use a complex password. These days, adding a number to the end of a word won’t cut it. You’ll want to make sure your password is long, and includes many combinations of numbers, letters, and characters. Use these recommendations when choosing a password.

Keep everything updated.

I can’t stress this point enough. The most common source of malware on sites is outdated software. New exploits in software are being found every day. Most plugins and themes will release a patch or update as soon as one is uncovered. So this means keeping everything updated is super important. This certainly includes WordPress itself. If you manage many sites, using a system like MainWP or ManageWP can help you manage updates from a single dashboard.

Never log in from a public computer.

Public computers at your library or internet cafes are not the most secure. Casual hackers may have installed software on these computers that records everything you type. You should also never choose for a public computer to remember your password.

Use SSL on your login page.

Last, using SSL encryption on any page where you enter a password is important. This encrypts the data you send over the network between your local computer and your website. Any bad actors listening on your network won’t be able to read encrypted information.


Conclusion

So, there you have it! A comprehensive list of methods to protect your WordPress site. And, with these quick and easy methods you can effectively prevent Brute Force attackers from accessing your site. Remember also that using a firewall or plugin isn’t everything. You also need to check the list of best practices to secure your site. With all these powers combined, you can be sure your site is safe.

Do you have more tips and tricks? Have more thoughts on Brute Force attacks? Comment below or contact me to talk more about security.

How To: Configure Varnish for Responsive Sites

Scalability vs Responsive Sites

A major part of performance with sites on any platform is ensuring that your website is highly cacheable. By caching pages to serve as static files to repeat users, this offloads a lot of server processing power. Without cache, your web server would have to re-process the code to generate your page. Not only does this make more work for your server, it could slow down the response time for your site.

A challenge developers face is how to cache their sites heavily, while still adapting to mobile devices. With Google PageSpeed’s score hinging on mobile compatibility, many themes in WordPress are adapting to offer responsive options. Chances are you’re wanting a different, mobile-friendly version of your site to show to your smartphone users. With page cache, your user sees whatever version was requested the last time the page was stored in cache. This equates to a poor experience for your users.

X-Device Cache Groups

So how do you handle this scenario? Difference circumstances require two different versions of the site. You can do this by adding an “X-Device Group” header based on the HTTP User Agent the request came from. This allows you to detect devices in Varnish. This way, any device you designate as “mobile” gets cached in a mobile group. At the same time, desktop users are cached in a separate cache group. So this solves our problem! A mobile user receives the mobile site. A desktop user receives the desktop site.

Example Config

So how do you detect devices in Varnish? Here’s an example setup:


# Cache different devices in different cache groups so they're served the right version
if ( req.http.User-Agent ~ "(?i)(tablet|ipad|playbook|silk)|(android(?!.*mobile))" ) {
# Cache tablet devices in the same group - it's possible this is different than smartphones for some sites
set req.http.X-Device = "tablet";
}
elsif ( req.http.User-Agent ~ "(?i)
Mobile|iP(hone|od)|Android|BlackBerry|IEMobile|Kindle|NetFront|Silk-Accelerated|(hpw|web)OS|Fennec|Minimo|Opera M(obi|ini)|Blazer|Dolfin|Dolphin|Skyfire|Zune" ) {
# Cache smartphones together. The mobile user-agents receive a mobile version with a responsive theme
set req.http.X-Device = "smartphone";
}
else {
# Cache everything else together. We assume anything that doesn't fit into the above regex is a regular desktop user.
set req.http.X-Device = "regular";
}


This snippet says to add a X-Device header to each of these device groups. It allows Varnish to cache the devices separately. You can set the header to whatever you prefer. Some prefer something more like X-Cache-Bucket, or X-Cache-Group (which WP Engine uses). If you’re curious how I came to this setup and these particular user-agents, I grabbed these from a pretty thoughtful list. And, Varnish published a very helpful guide on device detection that I snagged to get started.

When you detect devices in Varnish caching groups like this, it allows you to take full advantage of page caching, while still maintaining responsive behavior. That’s a win you can take to the bank! Using more cached pages equates to faster website load times.

Understanding Cache-Control Headers

What is a header?

Whether you’re using a caching mechanism on your site’s server or not, Cache-Control headers are important to your site’s scalability and your end-user’s experience. Caching, or storing a copy of the completed request, can drastically help limit what requests your web server actually has to serve. But before we dive deeper into headers and cache, let’s first define: what are headers?

Headers are bits of contextual information your web browser can send and receive with requests for pages and files. Certain headers are sent with a request, while others are associated with the response you receive back. In this article we’ll be focusing on the “response headers” specifically. However, some of the directives we talk about are available for “request headers” as well.

With each request sent on the web, headers are returned. Here’s an example of the headers I get from my own domain:

The response headers tell me some information about my request.

HTTP/1.1 200 OK – This is the HTTP response code. It tells me whether my request was successful (200), redirected (301/302), received an error (500), or forbidden (403). There are tons of different status codes you might receive. Check out the full list for more information.

Server: Nginx – This section tells me the type of server that responded to my request. My site is hosted on a stack that uses Nginx as the web server software.

Date: Thu, 10 Aug 2017 17:00:29 – This is simply the date and time the response was served.


What are Cache-Control headers?

Sites may include many other kinds of headers, but I want to specifically call out two more:

Cache-Control: max-age=600, must-revalidate – This header defines how long my page should be cached for. The number is in seconds, so this example indicates a 10-minute cache time.

X-Cache: MISS – The X-Cache header indicates whether my request is served from cache on the server or not. MISS means my request is not already in cache. It passes to the web server to process, then stores a copy in cache on the way back. The next time I hit my site’s home page within the 10 minute cache window, it will serve it from cache.


What kind of cache are we controlling?

Cache-Control headers are responsible for controlling all caches, including (but not limited to): public, private, and server-level page caches. The Cache-Control header in my example above tells my web browser (Chrome in this case) how long to keep the response in its local browser cache.

Source: developers.google.com

It also tells the Varnish page cache on my server how long to cache the page.

Souce: book.varnish-software.com

The difference between the two is where the cache exists. In my Chrome browser, I’ve told Chrome to cache the page for 10 minutes with this response header. But what if I purge the cache in Chrome? Varnish page cache on my web server has still cached the response for 10 minutes. So I may still see the cached result from Varnish, unless I purge the page cache on the server too.


What kind of caching directives can I use?

There’s a long list of directives accepted for Cache-Control headers. Some are accepted only for Response headers, while others are also accepted on Request headers.

“public” or “private” directives are accepted only in Response headers. The “public” directive means the response can be cached by any service, regardless of whether you have HTTP Basic Authentication in use on the site or not. Meanwhile, “private” says to only cache in the browser and not in persistent caches, like my server’s Varnish page cache. It means the information on that page should only be cached for that user and not others.

“max-age” directives tell the caching mechanism how long to cache the response before it is considered “stale.” In my example the “max-age” is set to 600 seconds, or 10 minutes. The max-age directive can be used in Request and Response headers.

“must-revalidate” says that once the cached response is considered “stale” (after 10 minutes in my example), it has to be re-fetched/served as new. This directive is only accepted on Response headers.

“no-cache” and “no-store” relate to whether the cached response has to be re-validated by the server (check if the response is the same), and whether the response or content has to be re-downloaded. If “no-cache” is present, the cache mechanism cannot serve the cached response. Instead it must re-check if the response is the same. And if “no-store” is present, the cache mechanism cannot store the data/downloaded content and has to re-fetch the content again. These directives are accepted on both Request and Response headers.

Where do I set these headers?

There are several places you can define caching directives. If you’re one of many on the web using an Apache web server, you can set these directives in the .htaccess file. With an Nginx web server, you can set this in your Nginx configuration. If you use both, you’re probably using Nginx to handle all requests and pass certain ones to Apache. This means you should use the Nginx method of setting these headers.

If you don’t have access to the .htaccess file or Nginx configuration for your site, there are plugins out there which can configure this for you. W3 Total Cache or WP Super Cache both work great for this. If you’re using a host that offers server-level page cache like WP Engine, they take care of the configuration for you.


How To: Debug WordPress with Query Monitor

What is Query Monitor?

Query Monitor is a plugin developed by one of the core contributors of WordPress, John Blackbourn. It is branded as a debugging tool for developers, and is widely used in the WordPress community. In short, it watches every WordPress transaction happening on the site when the current page is requested, to provide detailed analytics.

Why use Query Monitor?

There are a few specific scenarios in which Query Monitor is useful:

  • Your site has a high TTFB (Time to First Byte) on uncached views to the page, and you’ve narrowed the issue down to slow queries. Queries are used to construct pages from PHP and WordPress when requested, so if they are unoptimized, they can easily lead to high TTFB.
  • If queries are not being run when they should be, or if queries are returning incorrect results
  • You are experiencing wp-admin area slowness and turning off Object Caching helps the speed. Since Object Caching will cache repeated query results and transients, this helps narrow down the issue to the queries the pages are running.

When using Query Monitor, the most important parts to focus on will be the total execution time of the queries, how many/which ones are served from cache, and which queries are taking the longest amount of time. When Query Monitor is active, it is an option in your WordPress Admin bar. If you click the options from this menu, it will scroll to the bottom of the page. Here you will see the full Query Monitor analysis.

What else can it do?

Query Monitor not only monitors the queries running from your site! It also checks:

  • Which “caller” or function/hook is calling the query
  • Gives a trace of which piece of code is calling it
  • Gives a trace of any dependencies and conditionals being met by queries executed on the page
  • Provides a breakdown of how much time it took for all queries to run
  • How much Memory the page used in being generated
  • The percentage of queries that were served from Object Cache.
  • Which scripts are being run, their position on the page and a trace of which files the scripts are triggered from
  • It also detects any PHP Warnings or Errors generated by the page
  • Gives a report of the server the site is running on:
    • PHP version
    • Max_execution_time
    • Memory allotted to WordPress
    • Database being used
    • query_cache_limit (Object Cache)
    • Debugging information

All this data can be extremely helpful to developers looking to optimize their sites!

On top of the extra data it generates, it can be run on the front end without being logged in by setting a specific cookie (this setting is available at the bottom of the report when logged in initially). So in addition to debugging, this information can also help developers understand what conditionals and hooks their own code should hook into, to function properly.

Caveats

There are also some caveats to understand when using Query Monitor on some hosts and environments. These are some common errors to look out for:

  • Query cache: Query Monitor is checking to see if “mysql_query_cache” is being used. WP Engine and some other hosts use a separate service for query caching, called Object Cache. As a result, some of the information may lead you to believe that queries are not being cached, when in fact they are (as long as Object Cache is enabled). The cached percentage at the top of the report will still report this accurately.
  • Query Monitor was unable to symlink its db.php file into place: This error means that the Query Monitor is trying to symlink its own db.php file within its plugin directory to wp-content/db.php. Many webhosts will already have the db.php file in the wp-content directory, so often times this is a red herring.
  • Query Monitor on clustered environments: On clusters and redundant environments with multiple web servers, the requests that Query Monitor is tracking are run from the web servers of the cluster. However, in these environments MySQL is usually only run in READ only mode there. MySQL passes all write operations to the database master server. This conflicts with the code of Query Monitor, so it doesn’t work properly on these environments. In these cases, making a copy of your site to a single-server environment to test is best practice.

Making Sense of Google PageSpeed Scores

What is Google PageSpeed Insights?

If you’ve invested some time into making sure your site is performing well with your users, you’ve likely used the Google PageSpeed Insights tester to see how your site stacks up. This tool measures your site against a series of metrics and standards that it uses to help rank sites internet-wide. And, if you’re one of the many users of Google’s Adsense ads, this score directly affects the quality of the ads your site gets.

Unfortunately, Google PageSpeed Insights doesn’t get very verbose about why it ranked your site the way it did. And the suggestions can be hard to interpret if you’re not used to SEO and optimization terms. Not to worry, I’m here to break it down for you!


Avoid landing page redirects

This recommendation is pretty simple. It just means don’t redirect your home page to another page, either for desktop or mobile users. So for example, using a separate domain like “m.mysite.com” for mobile requests is actually less beneficial for SEO and less satisfying for users. Keep in mind with WordPress, most themes are automatically “responsive.” This means they already have built-in mobile support, without having to have an entirely separate site or domain for these users.

Also remember to check your site’s home page when testing with Google PageSpeed Insights. If your domain in the URL bar is “https://mysite.com/” then be sure to test that exact URL. Be sure you use the proper http:// or https:// version, and the correct “www” or “non-www” version.

Leverage browser caching

If Google PageSpeed Insights recommends this to you, be sure you check the resource it’s referencing. Is this resource called from your domain? Or is the resource called from another site? Some common examples are Google fonts, Google analytics tracking, or external API calls. If the resource is called from your own site, this means the request did not contain a header that said the web browser should cache that file or page. This means visitors to your site are having to request a new version from the server every time they visit the page. It’s best practice to include a “Cache-Control” header on the site that looks like this:

If you host with WP Engine, their platform configures page and static file caching for you automatically, so you don’t have to worry about adding these headers. Using a page caching plugin like W3 Total Cache or WP Super Cache will help you configure these headers if you don’t have a web host that configures this automatically.

When the resources showing in the details are not loading from your site’s URL, this score can be trickier to improve. However, the plugin Above the Fold Optimization has a setting that might help, called “External resource proxy” which will proxy those external resources to load from your own domain, and add the “Cache-Control” header.

Enable compression

Enabling compression is generally referring to gzip compression, which is a method of HTTP compression. For a comprehensive look at what gzip is and how it works, check out Torque’s handy guide. On WP Engine they configure this for you already at the server level. However, for other hosts you may have to either manually configure this in the .htaccess file, or use a plugin.W3 Total Cache offers “HTTP compression” which helps configure this for you in the .htaccess file. You can also use a plugin more specifically made for this task, like Check and Enable GZIP Compression.

Minify HTML, CSS, and/or Javascript

These warnings will show up if your CSS, Javascript, or HTML files referenced by your home page are not “minified.” Minification is the process of compressing and combining these files by taking out extra whitespace, comments, and formatting that might be adding to the time it takes your web browser to parse the response. The Autoptimize and BWP Minify plugins are both well-known plugins that specialize in minifying these assets on your site.

Eliminate render-blocking JavaScript and CSS in above-the-fold content

This can be one of the most confusing messages to receive when testing your site. To understand this message, you first have to understand what Above the Fold content is, and what would be considered “render blocking” JavaScript. In short, “Above the Fold” refers to what your user can see on their visible browser window (without scrolling down). It’s a legacy term that stems from the days of newspapers, where companies would have to strategically plan what would show above the literal fold of the newspaper.

As for “render blocking,” this is referring to JavaScript and CSS files that are being required to load before the site can start showing content. Until these assets are downloaded and processed by your web browser, you’ll see a blank white page. These assets are literally blocking your users from seeing your site’s content faster! If you use a tool like WebPageTest you can get a more clear view of this in action:

So how do you fix “render blocking” assets? You can use Above the Fold Optimization for this as well. The plugin has an option to “extract full CSS,” which you can then enter into a Critical CSS extractor to find what really needs to load before the page can render. The remaining assets can be deferred to the footer using the plugin’s settings!

Prioritize visible content

This warning goes hand-in-hand with the “Above the Fold” and “Render Blocking” warnings above. It just means you should only load Above the Fold content before the page render, and nothing more. You can use a Lazy Loading plugin to help with this, or Above the Fold Optimization has a setting for this as well.

Optimize images

You’ll see this warning if your site’s images have the potential to be “losslessly” compressed. This means eliminating extra metadata associated with those images, and compressing the image size without sacrificing image quality. Two of the most popular plugins for this are WP Smush, and EWWW Image Optimizer Cloud. Usually image compression plugins will have at least a small cost to perform the optimization. If you’re not wild on the idea of optimizing your images, you can alternatively compress the images locally and re-upload them.

Reduce server response time

Google PageSpeed insights will register this warning if your “Time to First Byte” is registering at .3 seconds or higher. Time to First Byte can be a confusing metric to understand! But most often, this comes down to optimizing your site’s PHP code and queries. Check out TTFB and PHP for more information about troubleshooting TTFB.


There you have it! Some quick and easy ways to increase your Google PageSpeed scores. And along the way, we’ve covered some background on what they mean in the context of WordPress. Using these insights you can take your site’s browser performance and SEO to the next level!

  • Page 1
  • Page 2
  • Next Page »

Footer

Categories

  • Ansible
  • AWS
  • Git
  • Linux
  • Optimization
  • Performance
  • PHP
  • Scalability
  • Security
  • Uncategorized
  • WordPress

Copyright © 2023 · Atmosphere Pro on Genesis Framework · WordPress · Log in