• Skip to main content
  • Skip to footer

TechGirlKB

Performance | Scalability | WordPress | Linux | Insights

  • Home
  • Speaking
  • Posts
    • Linux
    • Performance
    • Optimization
    • WordPress
    • Security
    • Scalability
  • About Janna Hilferty
  • Contact Me

Security

Automate Patching Using AWS Systems Manager (SSM)

AWS offers a plethora of useful tools, but as a DevOps Engineer, the Systems Manager has been a godsend. Systems Manager works by installing the SSM Agent on the instances you wish to manage. Through this agent and using a set of IAM capabilities, the agent can perform management tasks on your server inventory.

I love Systems Manager because it removes a lot of overhead for me in my daily work. Here’s an example: Recently we upgraded the operating system on our servers, and noticed that as a result, the timing mechanisms on our servers were off. There was a relatively quick fix, but it had to be deployed across all our (100+) servers, which would have taken hours. Instead, I wrote one script Document in Systems Manager, and (after safely testing it on one or two dev servers first), deployed the change to all servers in one fell swoop.

One of the great things about Systems Manager is that you can create your own Documents (either Automation documents, or RunCommand documents) to execute your own scripts. Or, to trigger existing scripts within your own script. Using this capability, we were able to create a script to schedule maintenance windows, perform patching, and notify important groups along the way. I thought I would share what we learned to help anyone else going through this process.

About SSM Documents

Documents is the term AWS uses to describe scripts, written in either JSON or YAML, which can be executed against your server inventory. Some are short and simple. Others are more complex, with hundreds of lines of code to be executed. Documents typically fall into one of two groups: RunCommand, or Automation. The difference lies mainly in the formatting. Automation Documents are typically workflows with several steps triggering other Documents to perform routine tasks. For example, one Automation we use assigns IAM roles that allow the server to write to CloudWatch logs (an Association). RunCommand Documents, by contrast, are mainly scripts or commands to run.

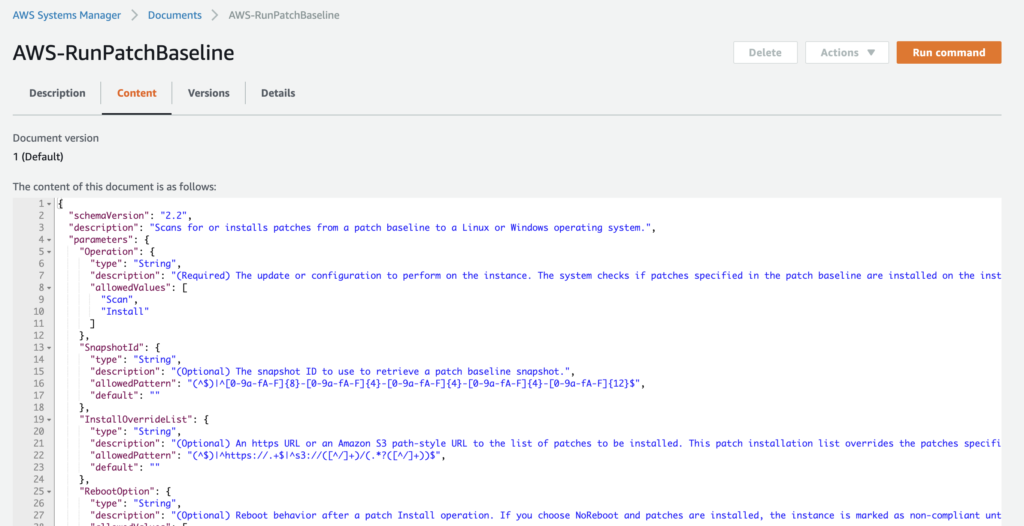
AWS has a number of Documents pre-made for you to use, namely, AWS-RunPatchBaseline which we will use later on. You can create your own documents as well, in JSON or YAML formats. I highly recommend using the pre-made documents as an example for syntax.

To run a RunCommand Document, you can trigger it to run from the RunCommand section. If your Document is an Automation Document, you can trigger it from the Automation section. You can register either Automation or RunCommand Documents within Maintenance Windows to run at a scheduled time if desired.

About AWS-RunPatchBaseline

The AWS-RunPatchBaseline Document is an especially useful document. This document uses the baseline for patching you have selected for your servers (under the Patch Manager section). For example, if you use CentOS Linux servers, you can use the pre-defined CentOS patch baseline to receive CentOS patches.

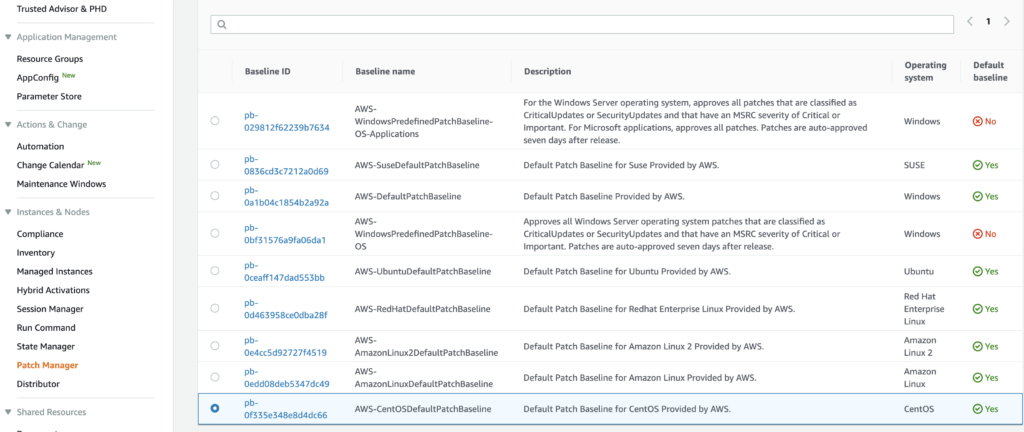
You can organize your servers running the SSM agent into various patching groups, to identify which servers should be patched together. In our case, the option to Create Patch Groups wasn’t functioning properly. But to manually configure the Patch Groups, you can add Tags to the server instances you wish to patch. The Key should be “Patch Group” and the Value can be whatever name you wish to give the patch group. For example, we originally divided patch groups into Develop, Staging, Production. But you can choose whichever groups make sense for your organization.

Automating Patching

Running the AWS-RunPatchBaseline command during your designated maintenance windows, on lower-level testing environments like Develop and Staging is one thing. Patching production is another thing entirely. The AWS-RunPatchBaseline command installs patches and updates to packages, but in order for the device to actually register the changes and show “In Compliance” (on the Compliance page), a Reboot has to take place.

While rebooting the server usually takes a minute or less time to complete, it can be disruptive to end users and support users. With that in mind, we should consider scheduling the patching with proper maintenance windows in our status pages, and in monitoring tools (Pingdom, etc.) since we expect downtime. Notifying Slack as patching is scheduled, beginning, and ending is a good idea as well.

While the solution below is certainly not the most refined and is pretty basic bash scripting, it does the trick for many patching needs. I’ll be sure to include “gotchas” we encountered as I go as well!

Getting started

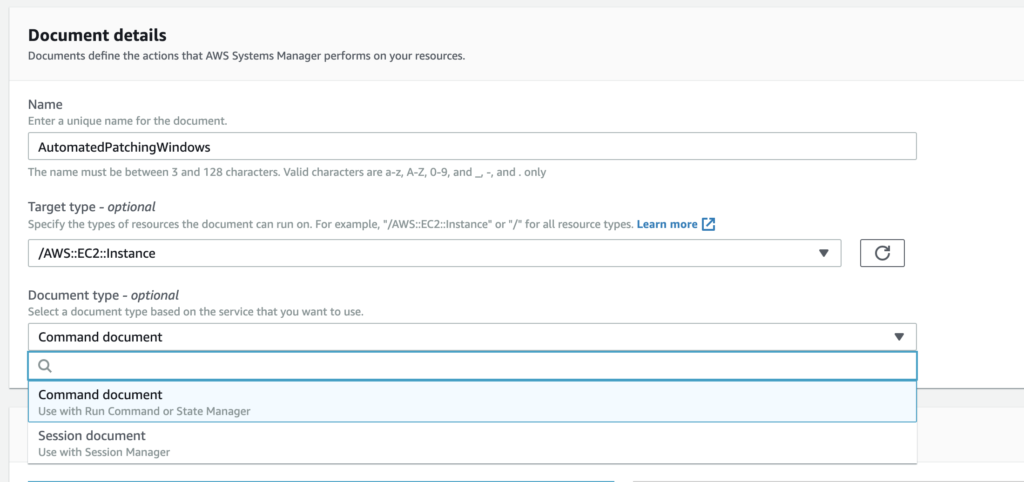
First, in the Documents section you will need to select “Create command or session” to start a new RunCommand document. Select a name, and the type of target (for most, this will be AWS::EC2::Instance). I’ll be showing how to format your script in JSON, but YAML is ok too.

To start, there are a few points of order to get out of the way at the beginning of your script. This includes things like defining any additional parameters for your script and its environment.

{
   "schemaVersion": "2.2",
   "description": "Command Document Example JSON Template",
   "mainSteps": [
     {
       "action": "aws:runShellScript",
       "name": "ApplyMaintenanceWindow",
       "inputs": {
         "runCommand": [

This part defines the schema version to be used (as of this writing, 2.2 is the latest). You can enter a description of this command if desired. After “description” you will need to include any additional parameters that should be selected when running the command, if any. In an earlier version of our Document, I had “appName” and “appEnv” parameters added, but eventually took these out, as these could be determined dynamically from our tagging structure.

If you choose to add Parameters, here is an example of how you can define appName and appEnv:

{
   "schemaVersion": "2.2",
   "description": "Command Document Example JSON Template",
   "parameters": {
     "appName": {
       "type": "String",
       "description": "(Required) Specify the app name",
       "allowedValues": [
         "App1",
         "App2",
         "App3"
       ]
     },
     "appEnv": {
       "type": "String",
       "description": "(Required) Specify the app environment",
       "default": "Develop",
       "allowedValues": [
         "Develop",
         "Staging",
         "Production"
       ]
     }
   },
   "mainSteps": [...

Gather tags

If you gather tags from your EC2 instances in other methods (such as writing them to a file for parsing) you can use this as a way to determine which instance you are running the command on as well. You can either do this entirely separate from patching (such as upon server build, or deploy of code). Or, you can do this at runtime as well. On AWS, you can use cURL to gather instance metadata, and use this to your benefit:

#!/usr/bin/env bash
# Requires aws cli to be installed and proper ec2 roles to read ec2 tags
# Requires sudo permissions to right to /etc/
INSTANCE_ID=`curl http://169.254.169.254/latest/meta-data/instance-id 2>/dev/null`
REGION=`curl http://169.254.169.254/latest/meta-data/placement/availability-zone 2>/dev/null | sed 's/.$//'`
aws ec2 describe-tags --region $REGION --filter "Name=resource-id,Values=$INSTANCE_ID" --output=text | sed -r 's/TAGS\t(.
)\t.\t.\t(.)/\1="\2"/' > /etc/ec2-tags

This script will write the tags to the /etc/ec2-tags path on your server, which can be read later.

Back in our Document, we can use that /etc/ec2-tags output (or you can use it within your Document as well if you like).

"mainSteps": [
     {
       "action": "aws:runShellScript",
       "name": "ApplyMaintenanceWindow",
       "inputs": {
         "runCommand": [
           "#!/bin/bash",
           "export APPENV=$(grep \"Environment\" /etc/ec2-tags | cut -d'\"' -f2)",
           "export APPNAME=$(grep \"AppName\" /etc/ec2-tags | cut -d'\"' -f2)",
           "export INSTANCE_ID=$(grep \"Name\" /etc/ec2-tags | cut -d'\"' -f2)",
...

Here we are defining the value of some variables that we will be using later in the script, to notify our maintenance windows/monitoring tools: the app environment, app name, and the instance ID (given by AWS).

Scheduling time frames

Now that we have identified which applications and environments are being patched, we need to identify timing. We should define what time the patching will begin, and end, for our notification and monitoring tools.

In my example, I want to schedule and notify for the maintenance 24 hours in advance. The tools I’ll be using are Pingdom and StatusPage, but as long as your monitoring tool has an API this is fairly easy to automate as well!

First you have to determine the time format your API accepts. For Pingdom, they accept UNIX timestamps (which we can get with a simple “date +%s” command). StatusPage.io by contrast uses a different and more unique format, so we have it formatted it as it expects to be read.

Quick Tip: We found that no matter the timezone specified in the StatusPage.io dashboard, it always interpreted the timezone as UTC. So to match the correct time (PST), we had to add 8 hours (or 7 hours during daylight savings time).

     "export STATUSPAGE_TIME_START=$(date +%C%y-%m-%dT%TZ -d +1day+8hours)",       
     "export STATUSPAGE_TIME_END=$(date +%C%y-%m-%dT%TZ -d +1day+8hours+15minutes)",       
     "export PINGDOM_TIME_START=$(date +%s -d +1day)", 
     "export PINGDOM_TIME_END=$(date +%s -d +1day+15minutes)",
...

Set the StatusPage and Pingdom IDs

Now that we have our time frames settled, we also need to tell our script what ID to use for Pingdom, and what ID to use for StatusPage.io. These values are required when making API calls to these services, and will likely be different based on the application name and environment. To do this we can set variables based on our APPNAME and APPENV vars we set earlier:

      "if [[ $APPNAME == \"APP1\" && $APPENV == \"Production\" ]]; then",
      "  export PINGDOM_ID=\"123456\"",
      "  export STATUSPAGE_ID=\"abc123def456\"",
      "elif [[ $APPNAME == \"APP1\" && $APPENV == \"Demo\" ]]; then",
      "  export PINGDOM_ID=\"NONE\"",
      "  export STATUSPAGE_ID=\"456def123abc\"",
      "elif [[ $APPNAME == \"App2\" && $APPENV == \"Production\" ]]; then",
      "  export PINGDOM_ID=\"789012,345678\"",
      "  export STATUSPAGE_ID=\"ghi456jkl789\"",
      "elif [[ $APPNAME == \"APP2\" && $APPENV == \"Demo\" ]]; then",
      "  export PINGDOM_ID=\"012345\"",
      "  export STATUSPAGE_ID=\"jkl678mno901\"",
      "else",
      "  export PINGDOM_ID=\"NONE\"",
      "  export STATUSPAGE_ID=\"NONE\"",
      "fi",
...

Some things to note about the above block:

  • We’re setting the values to “NONE” if there isn’t a Pingdom or StatusPage ID for the specific app and environment – this is also the default value if the app name and environment name don’t match the combinations presented, in our “else” clause.
  • If there are multiple Pingdom checks that should be paused during this patching window, you can enter the two IDs separated by a comma (no space) – see “App2 Production” for an example.

Making the API calls

Now that we have all the proper context we can make the API calls. There will be a few sets of API calls:

  1. First we will notify Slack/Microsoft Teams that patching will begin in 24hrs, and schedule the maintenance windows in Pingdom and Statuspage.
  2. Next we will give an hour warning to Slack/Microsoft Teams that the patching will begin soon.
  3. At the 24 hour mark we will send a notice to Slack/Microsoft Teams that the patching is beginning – Pingdom and Statuspage windows will automatically begin.
  4. We will run the AWS-RunPatchBaseline command, which involves a reboot of the system.
  5. After patching completes, we will notify Slack/Microsoft Teams that the patching has completed, and list the packages updated.

Patching Scheduled Notifications

Now for the fun part: making the API calls. You will need to replace the OAuth (StatusPage), Bearer (Pingdom), and webhook URL (Microsoft Teams) based on the API tokens and webhooks for your own environments.

      "# Add StatusPage notification of scheduled maintenance",
      "if [[ $STATUSPAGE_ID != \"NONE\" ]]; then",
      "  curl -X POST 'https://api.statuspage.io/v1/pages/********/incidents' -H 'Authorization:OAuth ********-****-****-****-********' -d \"incident[name]=Scheduled Maintenance for $APPNAME - $APPENV\" -d \"incident[status]=scheduled\" -d \"incident[impact_override]=maintenance\" -d \"incident[scheduled_for]=$STATUSPAGE_TIME_START\" -d \"incident[scheduled_until]=$STATUSPAGE_TIME_END\" -d \"incident[scheduled_auto_in_progress]=true\" -d \"incident[scheduled_auto_completed]=true\"-d \"incident[components][component_id]=under_maintenance\" -d \"incident[component_ids]=$STATUSPAGE_ID\"",
      "fi",
      "",
      "# Add Pingdom Maintenance window",
      "if [[ $PINGDOM_ID != \"NONE\" ]]; then",
      "  curl -X POST 'https://api.pingdom.com/api/3.1/maintenance' -H 'Content-Type: application/json' -H 'Authorization:Bearer ******_******************_*****************' -d '{\"description\": \"Maintenance for '$APPNAME' - '$APPENV'\", \"from\": '$PINGDOM_TIME_START', \"to\": '$PINGDOM_TIME_END', \"uptimeids\": \"'$PINGDOM_ID'\" }'",
      "fi",
      "",
      "# Notify Teams room of upcoming maintenance/patching",
      "curl -X POST 'https://outlook.office.com/webhook/*******-***-****-****-***********-****-****-****-************/IncomingWebhook/***********************/********-****-****-****-**********' -H 'Content-Type: application/json' -d '{\"@type\": \"MessageCard\", \"@context\": \"http://schema.org/extensions\", \"themeColor\": \"ECB22E\", \"summary\": \"AWS Patching Window Notifications\", \"sections\": [{\"activityTitle\": \"Patching Scheduled\", \"activitySubtitle\": \"Automated patching scheduled to begin in 24 hours\", \"facts\": [{\"name\": \"App Name\", \"value\": \"'$APPNAME' - '$APPENV'\"}, {\"name\": \"Instance Name\", \"value\": \"'$INSTANCE_ID'\"}], \"markdown\": true}]}'",
      ""
...

Note that the last API call (Microsoft Teams) can be replaced with a Slack one if needed as well:

      "# Notify Slack room of upcoming maintenance/patching",
      "curl -X POST 'https://hooks.slack.com/services/********/********/****************' -H 'Content-type: application/json' -d '{\"attachments\": [{ \"mrkdwn_in\": [\"text\"], \"title\": \"Patching Scheduled\", \"text\": \"Automated patching scheduled to begin in 24 hours\", \"color\": \"#ECB22E\", \"fields\": [{ \"title\": \"App Name\", \"value\": \"'$APPNAME' - '$APPENV'\", \"short\": \"false\"}, { \"title\": \"Instance Name\", \"value\": \"'$INSTANCE_ID'\", \"short\": \"false\"}] }] }'",
      ""
...

After sending our API calls we’ll want to sleep for 23 hours until it’s time for our next notification (1 hour warning):

{
  "name": "Sleep23Hours",
  "action": "aws:runShellScript",
  "inputs": {
    "timeoutSeconds": "82810",
    "runCommand": [
      "#!/bin/bash",
      "sleep 23h"
    ]
  }
},
...

Quick Tip: We noticed that the longest “timeoutSeconds” will allow is 24 hours (86400 seconds). If you set it higher than that value, it defaults to 10 minutes (600 seconds).

One-hour Notifications

  "name": "NotifySlack1Hour",
  "action": "aws:runShellScript",
  "inputs": {
    "runCommand": [
      "#!/bin/bash",
      "export APPENV=$(grep \"Environment\" /etc/ec2-tags | cut -d'\"' -f2)",
      "export APPNAME=$(grep \"AppName\" /etc/ec2-tags | cut -d'\"' -f2)"
      "export INSTANCE_ID=$(grep \"Name\" /etc/ec2-tags | cut -d'\"' -f2)",
      "# Notify room of upcoming maintenance/patching",
      "curl -X POST 'https://hooks.slack.com/services/********/********/****************' -H 'Content-type: application/json' -d '{\"attachments\": [{ \"mrkdwn_in\": [\"text\"], \"title\": \"Upcoming Patching\", \"text\": \"Automated patching scheduled to begin in 1 hour\", \"color\": \"#ECB22E\", \"fields\": [{ \"title\": \"App Name\", \"value\": \"'$APPNAME' - '$APPENV'\", \"short\": \"false\"}, { \"title\": \"Instance Name\", \"value\": \"'$INSTANCE_ID'\", \"short\": \"false\"}] }] }'"
    ]
  }
},

Or for Microsoft Teams:

      "# Notify Teams room of upcoming maintenance/patching",
      "curl -X POST 'https://outlook.office.com/webhook/********-****-****-****-****************-****-****-****-************/IncomingWebhook/********************/******************' -H 'Content-Type: application/json' -d '{\"@type\": \"MessageCard\", \"@context\": \"http://schema.org/extensions\", \"themeColor\": \"ECB22E\", \"summary\": \"AWS Patching Window Notifications\", \"sections\": [{\"activityTitle\": \"Upcoming Patching\", \"activitySubtitle\": \"Automated patching scheduled to begin in 1 hour\", \"facts\": [{\"name\": \"App Name\", \"value\": \"'$APPNAME' - '$APPENV'\"}, {\"name\": \"Instance Name\", \"value\": \"'$INSTANCE_ID'\"}], \"markdown\": true}]}'",
      ""
    ]
  }
},

Now we sleep for one more hour before patching:

{
  "name": "SleepAgainUntilMaintenance",
  "action": "aws:runShellScript",
  "inputs": {
    "timeoutSeconds": "3610",
    "runCommand": [
      "#!/bin/bash",
      "sleep 1h"
    ]
  }
},

Patching Beginning

{
  "name": "NotifySlackMaintenanceBeginning",
  "action": "aws:runShellScript",
  "inputs": {
    "runCommand": [
      "#!/bin/bash",
      "export APPENV=$(grep \"Environment\" /etc/ec2-tags | cut -d'\"' -f2)",
      "export APPNAME=$(grep \"AppName\" /etc/ec2-tags | cut -d'\"' -f2)",
      "export INSTANCE_ID=$(grep \"Name\" /etc/ec2-tags | cut -d'\"' -f2)",
      "# Notify Teams room of upcoming maintenance/patching",
      "curl -X POST 'https://outlook.office.com/webhook/********-****-****-****-****************-****-****-****-************/IncomingWebhook/********************/******************' -H 'Content-Type: application/json' -d '{\"@type\": \"MessageCard\", \"@context\": \"http://schema.org/extensions\", \"themeColor\": \"ECB22E\", \"summary\": \"AWS Patching Window Notifications\", \"sections\": [{\"activityTitle\": \"Patching Beginning\", \"activitySubtitle\": \"Automated patching has started\", \"facts\": [{\"name\": \"App Name\", \"value\": \"'$APPNAME' - '$APPENV'\"}, {\"name\": \"Instance Name\", \"value\": \"'$INSTANCE_ID'\"}], \"markdown\": true}]}'",
      ""
    ]
  }
},

Or for Slack:

 "# Notify Slack room of upcoming maintenance/patching",
      "curl -X POST 'https://hooks.slack.com/services/********/********/****************' -H 'Content-type: application/json' -d '{\"attachments\": [{ \"mrkdwn_in\": [\"text\"], \"title\": \"Patching Beginning\", \"text\": \"Automated patching has started\", \"color\": \"#ECB22E\", \"fields\": [{ \"title\": \"App Name\", \"value\": \"'$APPNAME' - '$APPENV'\", \"short\": \"false\"}, { \"title\": \"Instance Name\", \"value\": \"'$INSTANCE_ID'\", \"short\": \"false\"}] }] }'"

Followed by the actual patching task, calling upon the existing AWS-RunPatchBaseline document:

{
  "name": "installMissingUpdates",
  "action": "aws:runDocument",
  "maxAttempts": 1,
  "onFailure": "Continue",
  "inputs": {
    "documentType": "SSMDocument",
    "documentPath": "AWS-RunPatchBaseline",
    "documentParameters": {
      "Operation": "Install",
      "RebootOption": "RebootIfNeeded"
    }
  }
},

Post-Patching Notification

Now that the patching has occurred we can send some important data to our chat software (Slack or Microsoft Teams) detailing what was updated:

{
       "action": "aws:runShellScript",
       "name": "NotifyPatchingComplete",
       "inputs": {
         "runCommand": [
           "#!/bin/bash",
           "export APPENV=$(grep \"Environment\" /etc/ec2-tags | cut -d'\"' -f2)",
           "export APPNAME=$(grep \"AppName\" /etc/ec2-tags | cut -d'\"' -f2)",
           "export INSTANCE_ID=$(grep \"Name\" /etc/ec2-tags | cut -d'\"' -f2)",
           "export INSTALL_DATE=$(date \"+%d %b %C%y %I\")",
           "export PACKAGES=\"$(rpm -qa --last | grep \"${INSTALL_DATE}\" | cut -d' ' -f1)\"",
           "",
           "# Notify Slack room that patching is complete",
           "curl -X POST 'https://hooks.slack.com/services/********/********/****************' -H 'Content-type: application/json' -d '{\"attachments\": [{ \"mrkdwn_in\": [\"text\"], \"title\": \"Patching Complete\", \"text\": \"Automated patching is now complete\", \"color\": \"#2EB67D\", \"fields\": [{ \"title\": \"App Name\", \"value\": \"'$APPNAME' - '$APPENV'\", \"short\": \"false\"}, { \"title\": \"Instance Name\", \"value\": \"'$INSTANCE_ID'\", \"short\": \"false\"}, { \"title\": \"Packages Updated\", \"value\": \"'\"${PACKAGES}\"'\", \"short\": \"false\" }] }] }'"
         ]
       }
     }
   ]
 }

Or for Teams:

      "# Notify Teams room that patching is complete",
      "curl -X POST 'https://outlook.office.com/webhook/********-****-****-****-****************-****-****-****-************/IncomingWebhook/********************/******************' -H 'Content-Type: application/json' -d '{\"@type\": \"MessageCard\", \"@context\": \"http://schema.org/extensions\", \"themeColor\": \"2EB67D\", \"summary\": \"AWS Patching Window Notifications\", \"sections\": [{\"activityTitle\": \"Patching Complete\", \"activitySubtitle\": \"Automated patching is now complete\", \"facts\": [{\"name\": \"App Name\", \"value\": \"'$APPNAME' - '$APPENV'\"}, {\"name\": \"Instance Name\", \"value\": \"'$INSTANCE_ID'\"}, {\"name\": \"Packages Updated\", \"value\": \"'\"${PACKAGES}\"'\"}], \"markdown\": true}]}'",
      ""

Note how we’re getting the packages updated from our rpm -qa --last command, and using grep to find the packages updated in the last hour – this generates the list of $PACKAGES that our command receives and sends to Slack/Teams.

Quick tip: Because the list of packages is separated by a new line, we have to wrap it in single and double quotes (e.g. ‘”${PACKAGES}”‘) so that it’s interpreted properly.

Maintenance Windows

Now that we’ve completed our script, we’ll want to ensure it runs on a specified patching schedule. For my team, we patch different environments different weeks, and build patching windows based upon that timeframe. In AWS Systems Manager, you can use several building blocks to ensure the right groups get patched together, at the right times:

  • Resource Groups: Use these to group like-instances and resources together. For example, I use resource groups to group instances with the same tags (e.g. Environment=Develop and AppName=App1).
  • Target Groups: When you create a Maintenance Window, you can create Target Groups based on Resource Groups, Tags, or specifying literal Instance IDs. I recommend Resource Groups, as (at least for me) the Tags have been hit or miss in identifying the right resources.
  • Registered Tasks: The last step in creating a Maintenance Window is to register tasks to that window. In my case I registered tasks for each Target Group I created, because the system wouldn’t let me tag more than a few Target Groups in one task registration.

Some gotchas about your maintenance windows:

  • Only 5 maintenance windows can be executing at once. This was a problem for us since we had originally set a maintenance window for each app/env, and it amounted to far more than 5. Since our script is 24hrs long, that’s a fair amount of time to be restricted.
  • The cron/rate expressions are a little different. It’s not quite the same as a standard cron expression you’d use in crontab. For example, to run my window at 12:30am on the 4th Friday of every month, I used the following expression: cron(0 30 0 ? * FRI#4 *) – standing for second, minute, hour, day-of-month, month, day-of-week, year. So if I wanted 12:30:25am on the 1st and 15th of August, I’d use cron(25 30 0 1,15 8 * *).
  • The cron rates for Maintenance Windows and Associations are different. What is accepted for Associations vs Maintenance windows in terms of cron rate are defined in the AWS docs here: https://docs.aws.amazon.com/systems-manager/latest/userguide/reference-cron-and-rate-expressions.html

Conclusion

This script was a bit tricky to pull together with all the right elements and gotchas, especially since some are not documented much (if at all) in the AWS docs thus far. However, the end results have been absolutely worth the trouble! Systems Manager is a tool that AWS has been putting a lot of work into of late, and the improvements are wonderful — they’re just not fully documented quite yet. I hope my learning helps you in your own journey to automated patching! This has made our patching and compliance cycles painless, visible to the right parties, and auditable. Have any tips, tricks, or experiences you’d like to share? Leave a comment, or contact me.

Adding Nginx HSTS Headers on AWS Load Balancer

On AWS, if you use a load balancer (ELB or ALB) you may wonder how to properly add security headers. In our situation we already redirect all HTTP requests to HTTPS. However, our security organization wanted to explicitly see HSTS headers. In this article I will explain how to do this when using AWS load balancers in your ecosystem.

What is HSTS?

HSTS stands for HTTP Strict-Transport-Security. It’s a type of header that can be added to instruct browsers that your website should only be accessed over HTTPS going forward. Personally, I thought it might be possible to add these headers at the load balancer level. While AWS did add some new options for ALBs (like perform action based on cookie presence), setting a header was not one of them.

I think this StackOverflow answer explains the reasoning well. Essentially, the header needs to be set at the source: your web server. You also shouldn’t set this header for HTTP requests (as it won’t do anything), so you will need to ensure that your ALB is communicating with your EC2 instance via HTTPS (port 443).

Configuring HSTS

HSTS is a header that can be configured in your web server configuration files. In our case, we’ll be setting it up with our web server, Nginx. You’ll need to use the “add_header” directive in the ssl/443 block of the web server config (for me, /etc/nginx/sites-available/sitename.conf — though depending on your setup, the directory structure may be different).

## The nginx config
server {
  listen 80;
  server_name localhost;
  return 301 https://$host$request_uri;
}
server {
    listen   443 ssl;
    server_name  localhost;

# insert HSTS headers
    add_header Strict-Transport-Security "max-age=31536000; includeSubDomains; preload" always;

Once you’ve added your header, close the file and do nginx -t to test the config for any errors. If all checks out, do service nginx restart or systemctl nginx restart to apply the change.

About HSTS options

You’ll see in the section above, the Strict-Transport-Security header has a few options or flags appended. Let’s dive into what they mean:

  • max-age=31536000: This directive tells the browser how long to hold onto this setting, in seconds. 31536000 seconds is 365 days, or one year. That means your browser will remember to only load the website over HTTPS for a year from the first time you accessed it. The minimum max-age is 18 weeks (10886400 seconds), though .
  • includeSubDomains: This setting tells the browser to remember the settings for both the root domain (e.g. https://yoursite.com) and for subdomains (e.g. https://www.yoursite.com).
  • preload: This setting is used when your website is registered as “preload” with Chrome at https://hstspreload.org/. This tells all Chrome users to only access your website over HTTPS.

Verify HSTS

If HSTS is working properly, you’ll see it when curling for headers. Here’s what it should look like:

$ curl -ILk https://yourdomain.com
HTTP/2 200
date: Thu, 16 Jan 2020 19:25:15 GMT
content-type: text/html; charset=UTF-8
server: nginx
x-frame-options: Deny
last-modified: Thu, 16 Jan 2020 19:25:15 GMT
cache-control: no-store, no-cache, must-revalidate, post-check=0, pre-check=0
strict-transport-security: max-age=31536000; includeSubDomains; preload

If you prefer, you can also use the Inspect Element tools in your browser when you visit your domain. Open the Inspect Element console by right-clicking in your browser window, then click Network. Navigate to your website, and click the entry for your domain in the dropdown when it loads. You should see headers, including one for “strict-transport-security” in the list.

If you’re not seeing the header, check these things:

  • Did you restart nginx? If yes, did it show an error? If it did show an error, check the config file for any obvious syntax errors.
  • Did you make the change on the right server? I made this mistake at first too, which took me down a rabbit hole with no answers trying to find why AWS was stripping my HSTS headers. They weren’t, I was just making a very preventable mistake.
  • Is your ALB/ELB sending traffic to your EC2 instance over HTTPS/port 443? HSTS headers can’t be sent over HTTP/port 80, so you need to make sure that the load balancer is communicating over HTTPS.

Have you had issues enabling HSTS headers on AWS? Have experiences you want to share? Feel free to leave a comment, or contact me.

How to Create CIS-Compliant Partitions on AWS

If you use CIS (Center for Internet Security) ruleset in your security scans, you may need to create a partitioning scheme in your AMI that matches the recommended CIS rules. On AWS this becomes slightly harder if you use block storage (EBS). In this guide I’ll show how to create a partitioning scheme that complies with CIS rules.

Prerequisites:

  • AWS account
  • CentOS 7 operating system

CIS Partition Rules

On CentOS 7, there are several rules for partitions which both logically separate webserver-related files from things like logs, and limit execution of files (like scripts, or git clones, for example) in directories accessible by anyone (such as /tmp, /dev/shm, and /var/tmp).

The rules are as follows:

  • 1.1.2 Ensure separate partition exists for /tmp 
  • 1.1.3 Ensure nodev option set on /tmp partition 
  • 1.1.4 Ensure nosuid option set on /tmp partition 
  • 1.1.5 Ensure noexec option set on /tmp partition 
  • 1.1.6 Ensure separate partition exists for /var 
  • 1.1.7 Ensure separate partition exists for /var/tmp 
  • 1.1.8 Ensure nodev option set on /var/tmp partition 
  • 1.1.9 Ensure nosuid option set on /var/tmp partition 
  • 1.1.10 Ensure noexec option set on /var/tmp 
  • 1.1.11 Ensure separate partition exists for /var/log 
  • 1.1.12 Ensure separate partition exists for /var/log/audit
  • 1.1.13 Ensure separate partition exists for /home 
  • 1.1.14 Ensure nodev option set on /home partition 
  • 1.1.15 Ensure nodev option set on /dev/shm partition
  • 1.1.16 Ensure nosuid option set on /dev/shm partition
  • 1.1.17 Ensure noexec option set on /dev/shm partition

Below I’ll explain how to create a partition scheme that works for all the above rules.

Build your server

Start by building a server from your standard CentOS 7 AMI (Amazon Machine Image – if you don’t have one yet, there are some available on the Amazon Marketplace).

Sign in to your Amazon AWS dashboard and select EC2 from the Services menu.

In your EC2 (Elastic Compute Cloud dashboard), select the “Launch Instance” menu and go through the steps to launch a server with your CentOS 7 AMI. For ease of use I recommend using a t2-sized instance. While your server is launching, navigate to the “Volumes” section under the Elastic Block Store section:

Click “Create Volume” and create a basic volume in the same Availability Zone as your server.

After the volume is created, select it in the list of EBS volumes and select “Attach volume” from the dropdown menu. Select your newly-created instance from the list, and make sure the volume is added as /dev/sdf. *

*This is important – if you were to select “/dev/sda1” instead, it would try to attach as the boot volume, and we already have one of those attached to the instance. Also note, these will not be the names of the /dev/ devices on the server itself, but we’ll get to that later.

Partitioning

Now that your server is built, login via SSH and use sudo -i to escalate to the root user. Now let’s check which storage block devices are available:

# lsblk
NAME MAJ:MIN RM SIZE RO TYPE MOUNTPOINT
xvda 259:0 0 20G 0 disk
└─xvda1 259:1 0 20G 0 part /
xvdf 259:2 0 20G 0 disk

If you chose t2 instance sizes in AWS, you likely have devices “xvda” and “xvdf,” where “xvdf” is the volume we manually added to the instance. If you chose t3 instances you’ll likely see device names like nvme0n1 instead. These devices are listed under dev on your instance, for reference.

Now we’ll partition the volume we added using parted.

# parted /dev/xvdf 
(parted) p
Model: Xen Virtual Block Device (xvd)
Disk /dev/xvdf: 18432MiB
Sector size (logical/physical): 512B/512B
Partition Table: gpt
Disk Flags:

Number Start End Size File system Name Flags

(parted) mklabel gpt
(parted) mkpart vartmp ext4 2MB 5%
(parted) mkpart swap linux-swap 5% 10%
(parted) mkpart home ext4 10% 15%
(parted) mkpart usr ext4 15% 45%
(parted) mkpart varlogaudit ext4 45% 55%
(parted) mkpart varlog ext4 55% 65%
(parted) mkpart var ext4 65% 100%
(parted) unit GiB
(parted) p
Model: Xen Virtual Block Device (xvd)
Disk /dev/xvdf: 18.0GiB
Sector size (logical/physical): 512B/512B
Partition Table: gpt
Disk Flags:

Number Start End Size File system Name Flags
1 0.00GiB 1.00GiB 1.00GiB ext4 vartmp
2 1.00GiB 2.00GiB 1.00GiB linux-swap(v1) swap
3 2.00GiB 4.00GiB 2.00GiB ext4 home
4 4.00GiB 9.00GiB 5.00GiB ext4 usr
5 9.00GiB 11.0GiB 2.00GiB ext4 varlogaudit
6 11.0GiB 12.4GiB 1.40GiB ext4 varlog
7 12.4GiB 20.0GiB 7.60GiB ext4 var

(parted) align-check optimal 1
1 aligned
(parted) align-check optimal 2
2 aligned
(parted) align-check optimal 3
3 aligned
(parted) align-check optimal 4
4 aligned
(parted) align-check optimal 5
5 aligned
(parted) align-check optimal 6
6 aligned
(parted) align-check optimal 7
7 aligned
(parted) quit
Information: You may need to update /etc/fstab

Now when you run lsblk you’ll see the 7 partitions we created:

# lsblk 
NAME MAJ:MIN RM SIZE RO TYPE MOUNTPOINT
xvda 202:0 0 20G 0 disk
└─xvda1 202:1 0 20G 0 part /
xvdf 202:80 0 18G 0 disk
├─xvdf1 202:81 0 3.6G 0 part
├─xvdf2 202:82 0 922M 0 part
├─xvdf3 202:83 0 922M 0 part
├─xvdf4 202:84 0 4.5G 0 part
├─xvdf5 202:85 0 921M 0 part
├─xvdf6 202:86 0 1.8G 0 part
└─xvdf7 202:87 0 5.4G 0 part

After you’ve run through the steps above, you’ll have created the partitions, but now we need to mount them and copy the correct directories to the proper places.

First, let’s make the partitions filesystems using mkfs. We’ll need to do this for every partition except the one for swap! Note that we’re leaving out partition ID 2 in our loop below, which was the swap partition. After creating the filesystems, we’ll use mkswap to format our swap partition. Note also that you may need to change the “xvdf” parts to match the name of your secondary filesystem if it’s not xvdf.

# for I in 1 3 4 5 6 7; do mkfs.ext4 /dev/xvdf${I}; done
# mkswap /dev/xvdf2

Next, we’ll mount each filesystem. Start by creating directories (to which we will sync files from their respective places in existing the filesystem). Again, if your filesystem is not “xvdf” please update the commands accordingly before running.

# mkdir -p /mnt/vartmp /mnt/home /mnt/usr /mnt/varlogaudit /mnt/varlog /mnt/var
# mount /dev/xvdf1 /mnt/vartmp
# mount /dev/xvdf3 /mnt/home
# mount /dev/xvdf4 /mnt/usr
# mount /dev/xvdf5 /mnt/varlogaudit
# mount /dev/xvdf6 /mnt/varlog
# mount /dev/xvdf7 /mnt/var

Now, we’ll sync the files from their existing places, to the places we’re going to be separating into different filesystems. Note, for the tricky ones that are all in the same paths (/var, /var/tmp, /var/log, and /var/log/audit), we have to exclude the separated directories from the sync and create them as empty folders with the default 755 directory permissions.

# rsync -av /var/tmp/ /mnt/vartmp/ 
# rsync -av /home/ /mnt/home/
# rsync -av /usr/ /mnt/usr/
# rsync -av /var/log/audit/ /mnt/varlogaudit/
# rsync -av --exclude=audit /var/log/ /mnt/varlog/
# rsync -av --exclude=log --exclude=tmp /var/ /mnt/var/
# mkdir /mnt/var/log
# mkdir /mnt/var/tmp
# mkdir /mnt/var/log/audit
# mkdir /mnt/varlog/audit
# chmod 755 /mnt/var/log
# chmod 755 /mnt/var/tmp
# chmod 755 /mnt/var/log/audit
# chmod 755 /mnt/varlog/audit

Last, to create the /tmp partition in the proper way, we need to take some additional steps:

# systemctl unmask tmp.mount  
# systemctl enable tmp.mount
# vi /etc/systemd/system/local-fs.target.wants/tmp.mount

Inside the /etc/systemd/system/local-fs.target.wants/tmp.mount file, edit the /tmp mount to the following options:

[Mount]  
What=tmpfs
Where=/tmp
Type=tmpfs
Options=mode=1777,strictatime,noexec,nodev,nosuid

Now that the files are in the proper mounted directories, we can edit the /etc/fstab file to tell the server where to mount the files upon reboot. To do this, first, we’ll need to get the UUIDs of the partitions we’ve created:

# blkid 
/dev/xvda1: UUID="f41e390f-835b-4223-a9bb-9b45984ddf8d" TYPE="xfs" /dev/xvdf1: UUID="dbf88dd8-32b2-4cc6-aed5-aff27041b5f0" TYPE="ext4" PARTLABEL="vartmp" PARTUUID="5bf3e3a1-320d-407d-8f23-6a22e49abae4"
/dev/xvdf2: UUID="238e1e7d-f843-4dbd-b738-8898d6cbb90d" TYPE="swap" PARTLABEL="swap" PARTUUID="2facca1c-838a-4ec7-b101-e27ba1ed3240"
/dev/xvdf3: UUID="ac9d140e-0117-4e3c-b5ea-53bb384b9e3c" TYPE="ext4" PARTLABEL="home" PARTUUID="e75893d8-61b8-4a49-bd61-b03012599040"
/dev/xvdf4: UUID="a16400bd-32d4-4f90-b736-e36d0f98f5d8" TYPE="ext4" PARTLABEL="usr" PARTUUID="3083ee67-f318-4d8e-8fdf-96f7f06a0bef" /dev/xvdf5: UUID="c4415c95-8cd2-4f1e-b404-8eac4652d865" TYPE="ext4" PARTLABEL="varlogaudit" PARTUUID="37ed0fd9-8586-4e7b-b42e-397fcbf0a05c"
/dev/xvdf6: UUID="a29905e6-2311-4038-b6fa-d1a8d4eea8e9" TYPE="ext4" PARTLABEL="varlog" PARTUUID="762e310e-c849-48f4-9cab-a534f2fad590"
/dev/xvdf7: UUID="ac026296-4ad9-4632-8319-6406b20f02cd" TYPE="ext4" PARTLABEL="var" PARTUUID="201df56e-daaa-4d0d-a79e-daf30c3bb114"

In your /etc/fstab file, enter (something like) the following, replacing the UUIDs in this example with the ones in your blkid output. Be sure to scroll all the way over to see the full contents of the snippet below!

#
# /etc/fstab
# Created by anaconda on Mon Jan 28 20:51:49 2019
#
# Accessible filesystems, by reference, are maintained under '/dev/disk'
# See man pages fstab(5), findfs(8), mount(8) and/or blkid(8) for more info
#

UUID=f41e390f-835b-4223-a9bb-9b45984ddf8d / xfs defaults 0 0
UUID=ac9d140e-0117-4e3c-b5ea-53bb384b9e3c /home ext4 defaults,noatime,acl,user_xattr,nodev,nosuid 0 2
UUID=a16400bd-32d4-4f90-b736-e36d0f98f5d8 /usr ext4 defaults,noatime,nodev,errors=remount-ro 0 2
UUID=c4415c95-8cd2-4f1e-b404-8eac4652d865 /var/log/audit ext4 defaults,noatime,nodev,nosuid 0 2
UUID=a29905e6-2311-4038-b6fa-d1a8d4eea8e9 /var/log ext4 defaults,noatime,nodev,nosuid 0 2
UUID=ac026296-4ad9-4632-8319-6406b20f02cd /var ext4 defaults,noatime,nodev,nosuid 0 2
UUID=238e1e7d-f843-4dbd-b738-8898d6cbb90d swap swap defaults 0 0
UUID=dbf88dd8-32b2-4cc6-aed5-aff27041b5f0 /var/tmp ext4 defaults,noatime,nodev,nosuid,noexec 0 0
tmpfs /dev/shm tmpfs defaults,nodev,nosuid,noexec 0 0
tmpfs /tmp tmpfs defaults,noatime,nodev,noexec,nosuid,size=256m 0 0

If you were to type df -h at this moment, you’d likely have output like the following, since we mounted the /mnt folders:

# df -h 
Filesystem Size Used Avail Use% Mounted on
/dev/xvda1 20G 2.4G 18G 12% /
devtmpfs 1.9G 0 1.9G 0% /dev
tmpfs 1.9G 0 1.9G 0% /dev/shm
tmpfs 1.9G 17M 1.9G 1% /run
tmpfs 1.9G 0 1.9G 0% /sys/fs/cgroup
tmpfs 379M 0 379M 0% /run/user/1000
/dev/xvdf1 3.5G 15M 3.3G 1% /mnt/vartmp
/dev/xvdf3 892M 81M 750M 10% /mnt/home
/dev/xvdf4 4.4G 1.7G 2.5G 41% /mnt/usr
/dev/xvdf5 891M 3.5M 826M 1% /mnt/varlogaudit
/dev/xvdf6 1.8G 30M 1.7G 2% /mnt/varlog
/dev/xvdf7 5.2G 407M 4.6G 9% /mnt/var

But, after a reboot, we’ll see those folders mounted as /var, /var/tmp, /var/log, and so on. One more important thing: If you are using selinux, you will need to restore the default file and directory contexts — this prevents you from being locked out of SSH after a reboot!

# touch /.autorelabel;reboot

Wait a few minutes, and then SSH in to your instance once more. Post-reboot, you should see your folders mounted like the following:

# df -h
Filesystem Size Used Avail Use% Mounted on
devtmpfs 1.9G 4.0K 1.9G 1% /dev
tmpfs 1.9G 0 1.9G 0% /dev/shm
tmpfs 1.9G 25M 1.9G 2% /run
tmpfs 1.9G 0 1.9G 0% /sys/fs/cgroup
/dev/xvda1 20G 5.7G 15G 29% /
/dev/xvdf4 4.8G 2.6G 2.0G 57% /usr
/dev/xvdf7 7.4G 577M 6.4G 9% /var
/dev/xvdf3 2.0G 946M 889M 52% /home
/dev/xvdf1 991M 2.6M 922M 1% /var/tmp
/dev/xvdf6 1.4G 211M 1.1G 17% /var/log
/dev/xvdf5 2.0G 536M 1.3G 30% /var/log/audit
tmpfs 256M 300K 256M 1% /tmp
tmpfs 389M 0 389M 0% /run/user/1002
tmpfs 389M 0 389M 0% /run/user/1000

Voila! You’ve successfully created partitions that are compliant with CIS rules. From here you can select your instance in the EC2 dashboard, click “Actions” > “Stop,” and then “Actions” > “Image” > “Create Image” to create your new AMI using these partitions for use going forward!

Please note, I’ve done my best to include information for other situations, but these instructions may not apply to everyone or every template you may use on AWS or CentOS 7. Thanks again, and I hope this guide helps!

phpdbg: Increase Unit Test speed dramatically

In our current deploy setup, there exists more than 200,000 lines of code for some of our apps. Naturally, this means there are a LOT of unit tests paired with this code which need to be run, and that code coverage reports take a long time. Running the unit tests by themselves (nearly 2600 tests) took around 30 minutes to complete. However, adding in the code coverage to that run bumped the time up dramatically, to nearly 3 hours:

./vendor/bin/phpunit --coverage-clover ./tests/coverage/clover.xml
...
...
... (a lot of unit tests later)
Time: 2.88 hours, Memory: 282.50MB
OK (2581 tests, 5793 assertions)
Generating code coverage report in Clover XML format … done
Generating code coverage report in HTML format … done
Thing move a little… slowly… around here…

The dilemma

In the existing setup, our deployment service received a webhook from our source code management software every time code was merged to the develop branch. The deployment service then pushed the code change to the server, ran our ansible deployment scripts, and then ran unit tests on the actual develop server environment. This was not ideal, for a few reasons:

  1. Bad code (malicious or vulnerable code, code that breaks functionality, or code that just doesn’t work) could be pushed to the server without testing happening first.
  2. Things could be left in a broken state if the deployment were to fail its unit tests, with no real accountability to fix the issue.
  3. The unit tests take so long it was causing the deployment service to reach its 40 minute timeout just on the unit tests, not even including the code coverage.
That’s gonna be a yikes from me, hombre

In a more ideal world, the deployment to the develop server environment should be gated by the unit tests (and security scanning as well) so that code is only deployed when tests are successful. And, the most ideal way to do this would be with an automated CI/CD pipeline.

We already had some regression testing setup in Jenkins, so creating a pipeline was certainly an option. The dilemma, however, was how to generate code coverage feedback in a reasonable amount of time, without waiting 3 hours for said feedback. Enter phpdbg.

The solution

phpdbg is an alternative to xdebug, and is an interactive PHP debugger tool. Unfortunately the documentation has very little information on usage or installation, but does mention that PHP 5.6 and higher come with phpdbg included.

That information, plus a few promising blog posts (including one from Sebastian Bergmann of phpunit himself and one from remi repo’s blog) gave us hope for a faster solution:

  • http://kizu514.com/blog/phpdbg-is-much-faster-than-xdebug-for-code-coverage/
  • https://hackernoon.com/generating-code-coverage-with-phpunite-and-phpdbg-4d20347ffb45
  • https://medium.com/@nicocabot/speed-up-phpunit-code-coverage-analysis-4e35345b3dad
  • https://blog.remirepo.net/post/2015/11/09/PHPUnit-code-coverage-benchmark
  • https://thephp.cc/news/2015/08/phpunit-4-8-code-coverage-support

If this tool worked as promised, it could save a massive amount of processing time for very similar code coverage calculation results, and a little bit more Memory. Relatively small trade-offs for some big benefits, if you ask me.

Making the solution work

As it turns out, the silver bullet was more like a “bang your head on your desk until it works” kind of solution. What I read was promising, but I kept running into issues in execution.

  • First, since our Jenkins instance had PHP 7.2 installed, it sounded like phpdbg should work right out of the box since it’s included in PHP from version 5.6+, right? Unfortunately, phpdbg wasn’t an available bin to be used, and wasn’t one of the packages installed with yum on our CentOS 7 servers.
  • This github (now archived) from user krakjoe indicated if I just installed PHP from source using this repo it would work, but this too failed (and caused all other PHP functions to stop working).
  • Eventually I stumbled upon these remi rpms that actually include phpdbg. The fun didn’t stop there, though…
  • Firstly, installing the yum package worked well enough, but it took me a minute to realize that the bin is actually under “php72-phpdbg” and not just “phpdbg”. No big deal, so far…
  • Now I actually had the php72-phpdbg command working and could enter the command line, but when I wrapped the phpunit commands with it, I was getting errors about other php packages (intl, pecl-zip, etc) not being installed. It turns out the php72-phpdbg package was from the “remi-safe” repo, which didn’t recognize the other php packages (which had been installed with the remi-php72 repo). To fix this, I had to install all the remi-php72 packages with the remi-safe repo instead.
Just shake it off, buddy

At the end of the day when the dust settled, we got the results we were hoping for:

php72-phpdbg -qrr ./vendor/bin/phpunit --coverage-clover ./tests/coverage/clover.xml 
...
...
... (a lot of unit tests later)
Time: 36.37 minutes, Memory: 474.50MB
OK (2581 tests, 5793 assertions)
Generating code coverage report in Clover XML format … done
Generating code coverage report in HTML format … done

Our coverage generator showed results were about half a percent difference lower than with phpunit alone (using Xdebug). Some users have reported coverage differences more than this, or are more concerned about the differences. For us, the difference is not in our favor (lower than original results), so we are less concerned. The benefits far outweigh the concern in our situation.

Conclusion

There was a steep curve in figuring out how to install and properly use phpdbg on our servers, but in the end, saving over 2 hours per run and allowing ourselves to gate deploys to the develop server environment based on quality and security in this way made the effort totally worth it. The biggest struggle in this process was the lack of documentation out there on phpdbg, so hopefully this article helps others who may be in the same boat!

smell ya later homies!

Adding version control to an existing application

Most of us begin working on projects, websites, or applications that are already version controlled in one way or another. If you encounter one that’s not, it’s fairly easy to start from exactly where you are at the moment by starting your git repository from that point. Recently, however, I ran into an application which was only halfway version controlled. By that I mean, the actual application code was version controlled, but it was deployed from ansible code hosted on a server that was NOT version controlled. This made the deploy process frustrating for a number of reasons.

  • If your deploy fails, is it the application code or the ansible code? If the latter, is it because something changed? If so, what? It’s nearly impossible to tell without version control.
  • Not only did this application use ansible to deploy, it also used capistrano within the ansible roles.
  • While the application itself had its own AMI that could be replicated across blue-green deployments in AWS, the source server performing the deploy did not — meaning a server outage could mean a devastating loss.
  • Much of the ansible (and capistrano) code had not been touched or updated in roughly 4 years.
  • To top it off, this app is a Ruby on Rails application, and Ruby was installed with rbenv instead of rvm, allowing multiple versions of ruby to be installed.
  • It’s on a separate AWS account from everything else, adding the fun mystery of figuring out which services it’s actually using, and which are just there because someone tried something and gave up.

As you might imagine, after two separate incidents of late nights trying to follow the demented rabbit trail of deployment issues in this app, I had enough. I was literally Lucille Bluth yelling at this disaster of an app.

It was a hot mess.

Do you ever just get this uncontrollable urge to take vengeance for the time you’ve lost just sorting through an unrelenting swamp of misery caused by NO ONE VERSION-CONTROLLING THIS THING FROM THE BEGINNING? Well, I did. So, below, read how I sorted this thing out.

Start with the basics

First of all, we created a repository for the ansible/deployment code and put the existing code on this server in place. Well, kind of. It turns out there were some keys and other secure things that shouldn’t be just checked into a git repo willy-nilly, so we had to do some strategic editing.

Then I did some mental white-boarding, planning out how to go about this metamorphosis. I knew the new version of this app’s deployment code would need a few things:

  • Version control (obviously)
  • Filter out which secure items were actually needed (there were definitely some superfluous ones), and encrypt them using ansible-vault.
  • Eliminate the need for a bastion/deployment server altogether — AWS CodeDeploy, Bitbucket Pipelines, or other deployment tools can accomplish blue-green deployments without needing an entirely separate server for it.
  • Upgrade the CentOS version in use (up to 7 from 6.5)
  • Filter out unnecessary work-arounds hacked into ansible over the years (ANSIBLE WHAT DID THEY DO TO YOU!? :sob:)
  • Fix the janky way Passenger was installed and switch it from httpd/apache as its base over to Nginx
  • A vagrant/local version of this app — I honestly don’t know how they developed this app without this the whole time, but here we are.

So clearly I had my work cut out for me. But if you know me, you also know I will stop at nothing to fix a thing that has done me wrong enough times. I dove in.

Creating a vagrant

Since I knew what operating system and version I was going to build, I started with my basic ansible + vagrant template. I had it pull the regular “centos/7” box as our starting point. To start I was given a layout like this to work with:

+ app_dev
- deploy_script.sh
- deploy_script_old.sh
- bak_deploy_script_old_KEEP.sh
- playbook.yml
- playbook2.yml
- playbook3.yml
- adhoc_deploy_script.sh
+ group_vars
- localhost
- localhost_bak
- localhost_old
- localhost_template
+ roles
+ role1
+ tasks
- main.yml
+ templates
- application.yml
- database.yml
- role2
+ tasks
- main.yml
+ templates
- application.yml
- database.yml
- role3
+ tasks
- main.yml
+ templates
- application.yml
- database.yml

There were several versions of old vars files and scripts leftover from the years of non-version-control, and inside the group_vars folder there were sensitive keys that should not be checked into the git repo in plain text. Additionally, the “templates” seemed to exist in different forms in every role, even though only one role used it.

I re-arranged the structure and filtered out some old versions of things to start:

+ app_dev
- README.md
- Vagrantfile
+ provisioning
- web_playbook.yml
- database_playbook.yml
- host.vagrant
+ group_vars
+ local
- local
+ develop
- local
+ staging
- staging
+ production
- production
+ vaulted_vars
- local
- develop
- staging
- production
+ roles
+ role1
+ tasks
- main.yml
+ templates
- application.yml
- database.yml
- role2
+ tasks
- main.yml
- role3
+ tasks
- main.yml
+ scripts
- deploy_script.sh
- vagrant_deploy.sh

Inside the playbooks I lined out the roles in the order they seemed to be run from the deploy_script.sh, so they could be utilized by ansible in the vagrant build process. From there, it was a lot of vagrant up, finding out where it failed this time, and finding a better way to run the tasks (if they were even needed, as often times they were not).

Perhaps the hardest part was figuring out the capistrano deploy part of the deploy process. If you’re not familiar, capistrano is a deployment tool for Ruby, which allows you to remotely deploy to servers. It also does some things like keeping old versions of releases, syncing assets, and migrating the database. For a command as simple as bundle exec cap production deploy (yes, every environment was production to this app, sigh), there was a lot of moving parts to figure out. In the end I got it working by setting a separate “production.rb” file for the cap deploy to use, specifically for vagrant, which allows it to deploy to itself.

# 192.168.67.4 is the vagrant webserver IP I setup in Vagrant
role :app, %w{192.168.67.4}
role :primary, %w{192.168.67.4}
set :branch, 'develop'
set :rails_env, 'production'
server '192.168.67.4', user: 'vagrant', roles: %w{app primary}
set :ssh_options, {:forward_agent => true, keys: ['/path/to/vagrant/ssh/key']}

The trick here is allowing the capistrano deploy to ssh to itself — so make sure your vagrant private key is specified to allow this.

Deploying on AWS

To deploy on AWS, I needed to create an AMI, or image from which new servers could be duplicated in the future. I started with a fairly clean CentOS 7 AMI I created a week or so earlier, and went from there. I used ansible-pull to checkout the correct git repository and branch for the newly-created ansible app code, then used ansible-playbook to work through the app deployment sequence on an actual AWS server. In the original app deploy code I brought down, there were some playbooks that could only be run on AWS (requiring data from the ansible ec2_metadata_facts module to run), so this step also involved troubleshooting issues with these pieces that did not run on local.

After several prototype servers, I determined that the AMI should contain the base packages needed to install Ruby and Passenger (with Nginx), as well as rbenv and ruby itself installed into the correct paths. Then the deploy itself will install any additional packages added to the Gemfile and run the bundle exec cap production deploy, as well as swapping new servers into the ELB (elastic load balancer) on AWS once deemed “healthy.”

This troubleshooting process also required me to copy over the database(s) in use by the old account (turns out this is possible with the “Share” option for RDS snapshots from AWS, so that was blissfully easy), create a new Redis instance, copy over all the s3 assets to a bucket in the new account, and create a Cloudfront instance to serve those assets, with the appropriate security groups to lock all these services down. Last, I updated the vaulted variables in ansible to the new AMIs, RDS instances, Redis instances, and Cloudfront/S3 instances to match the new ones. After verifying things still worked as they should, I saved the AMI for easily-replicable future use.

Still to come

A lot of progress has been made on this app, but there’s more still to come. After thorough testing, we’ll need to switch over the DNS to the new ELB CNAME and run entirely from the new account. And there is pipeline work in the future too — whereas before this app was serving as its own “blue-green” deployment using a “bastion” server of sorts, we’ll now be deploying with AWS CodeDeploy to accomplish the same thing. I’ll be keeping the blog updated as we go. Until then, I can rest easy knowing this app isn’t quite the hot mess I started with.

Migrating PHP 5.6 to PHP 7.2 with Ansible: DevOps Digest

If you’re hip to the news in the PHP community, you’ve probably heard that as of December 2018, PHP 5.6 (the most widely-used version of PHP) has reached End of Life, and will also no longer receive back-patches for security updates. To top it off, PHP 7 also reached End of Life and end of security support in the same month. That means a wealth of PHP users are now needing to upgrade in a hurry.

Generally speaking, upgrading your website or application to a newer PHP version isn’t quite as easy as it sounds. Sure, you can type the command to install the new version, but that doesn’t offer any guarantee that your site will still work once that update completes. In this article I’ll explain how I went about updating my organization’s apps to PHP 7.2 in a programmatic way, since we use Ansible to deploy apps and build local vagrants.

Start with the Ansible code

As a DevOps Engineer, part of my job is maintaining and updating our Ansible playbooks and deployments. In our Ansible setup, we have a shared repository of playbooks that all our apps use, and then each app also has an Ansible repository with playbooks specific to that app as well. In order to update to PHP 7.2, I had to undertake updating the shared playbooks and the app-specific playbooks. I started with the shared ones.

To start, I looked at the remi repo blog to see how they suggested upgrading PHP. Our shared ansible repository installs the basics – your LAMP stack, or whatever variation of that you may use. So first, I located where our ansible code installed the remi and epel repos.

- name: install remi and epel repo from remote 
yum:
name:
- "{{ remi_release_url }}"
- "{{ epel_release_url }}"
become: true

Notice the place to insert the URL to install the URL from is set as a variable – this means any one of the apps that uses this shared ansible code could set its own value for “remi_release_url” or “epel_release_url” to upgrade to a new version going forward. I set the “default” value for these to the URLs for PHP7 as specified in the remi repo blog.

Next, we get the correct key for the remi repo as specified on the blog:name: get remi key
get_url: url={{ remi_key_url }} dest=/etc/pki/rpm-gpg/RPM-GPG-KEY-remi
become: true

- name: get remi key
  get_url: 
    url: "{{ remi_key_url }}" 
    dest: /etc/pki/rpm-gpg/RPM-GPG-KEY-remi
  become: true 

Notice we’ve also set “remi_key_url” as a variable, so that if an app chooses to define a new PHP version, they can set the correct key to use for that version as well.

Now that we’ve got the right repos and keys installed, we can install packages using yum. But in doing so, we can define the correct remi repo to select from — in our case, remi-php72.

- name: install php7 packages 
yum:
name:
- php
- nginx
- php-fpm
- php-mysql
- php-pdo
- php-mbstring
- php-xml
- php-gd
enablerepo: "remi-{{ php_version }},epel"
become: true

Your list of packages may be the same or different, depending on your app’s requirements. The important thing to note here is another variable: “php_version”. This variable is then set in each of the apps to “php72” for now, and can easily be swapped for “php73” or higher as support ends for those versions in the future.

App-specific Ansible changes

Once I had committed my changes to a branch in the shared ansible code, all that was left was to make slight changes to each of my ansible app repos that used this code.

I started by defining the php_version to “php72” and defining the correct repo URLs and key:

php_version: php72
remi_release_url: "http://rpms.remirepo.net/enterprise/remi-release-6.rpm"
epel_release_url: "https://dl.fedoraproject.org/pub/epel/epel-release-latest-6.noarch.rpm"
remi_key_url: "http://rpms.remirepo.net/RPM-GPG-KEY-remi"

This allowed remi to do its thing installing the right versions for the right PHP version.

Next, I went through all the playbooks specific to the app and looked for more yum install sections that might be installing more packages, and ensured they used the “enable_repo” flag with the “remi, remi-{{ php_version }}” value. This means all the additional packages installed for each app will also be installed from the correct remi repo for PHP 7.2.

Last, I ensured our local vagrants built successfully and with no errors using the new PHP version and packages. We ran into very few errors in building the vagrants locally, but the app code itself did need some work, which brings us to the last step.

Update app code

As the DevOps Engineer, I partnered with the lead developer of each application we support to fix any compatibility issues. We use the phpunit tests, as well as phpcs (code sniffing) to detect any issues. We ended up updating our versions of these to check for PHP 7.2 compatibility, and this pointed the developers of each project to the compatibility issues. Some apps certainly had more errors to fix than others, but having the visibility and working vagrants built with Ansible was the key to success.

The other important thing that helped our development teams in this process was having a true local > dev > stage > prod workflow. This allowed us to push to dev, have the developers troubleshoot and fix issues, promote it to staging in a structured release, have QA team members run test suites against it, and finally (only when all is verified as good), push to production. Deploying through all these stages allowed us to work out any kinks before the code made it to production, and it took us about a month from start to finish.


I hope you enjoyed learning about our path to PHP 7! If you have any comments, feedback, or learnings from your journey as well, feel free to leave them in the comments or contact me.

  • Page 1
  • Page 2
  • Next Page »

Footer

Categories

  • Ansible
  • AWS
  • Git
  • Linux
  • Optimization
  • Performance
  • PHP
  • Scalability
  • Security
  • Uncategorized
  • WordPress

Copyright © 2025 · Atmosphere Pro on Genesis Framework · WordPress · Log in