• Skip to main content
  • Skip to footer

TechGirlKB

Performance | Scalability | WordPress | Linux | Insights

  • Home
  • Speaking
  • Posts
    • Linux
    • Performance
    • Optimization
    • WordPress
    • Security
    • Scalability
  • About Janna Hilferty
  • Contact Me

Posts

How To: Debug WordPress with Query Monitor

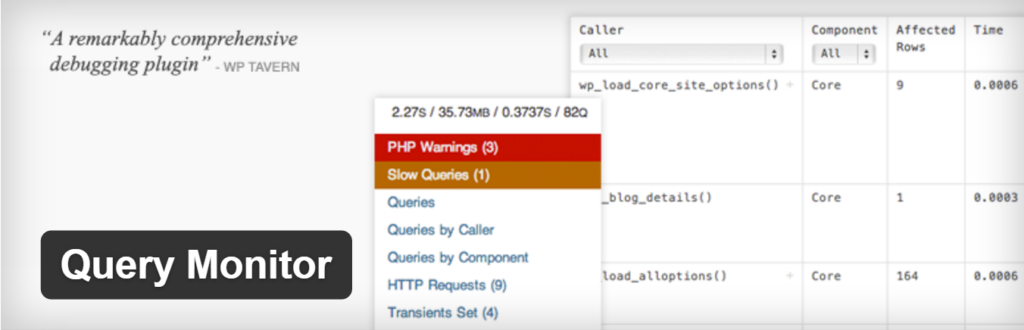
What is Query Monitor?

Query Monitor is a plugin developed by one of the core contributors of WordPress, John Blackbourn. It is branded as a debugging tool for developers, and is widely used in the WordPress community. In short, it watches every WordPress transaction happening on the site when the current page is requested, to provide detailed analytics.

Why use Query Monitor?

There are a few specific scenarios in which Query Monitor is useful:

  • Your site has a high TTFB (Time to First Byte) on uncached views to the page, and you’ve narrowed the issue down to slow queries. Queries are used to construct pages from PHP and WordPress when requested, so if they are unoptimized, they can easily lead to high TTFB.
  • If queries are not being run when they should be, or if queries are returning incorrect results
  • You are experiencing wp-admin area slowness and turning off Object Caching helps the speed. Since Object Caching will cache repeated query results and transients, this helps narrow down the issue to the queries the pages are running.

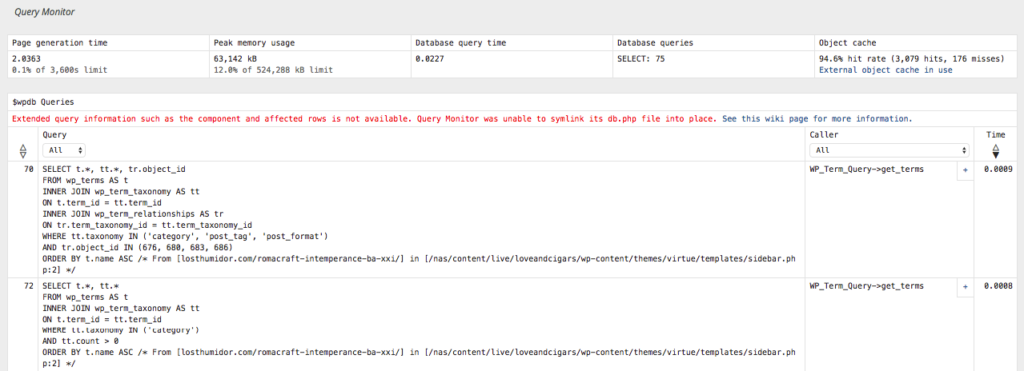
When using Query Monitor, the most important parts to focus on will be the total execution time of the queries, how many/which ones are served from cache, and which queries are taking the longest amount of time. When Query Monitor is active, it is an option in your WordPress Admin bar. If you click the options from this menu, it will scroll to the bottom of the page. Here you will see the full Query Monitor analysis.

What else can it do?

Query Monitor not only monitors the queries running from your site! It also checks:

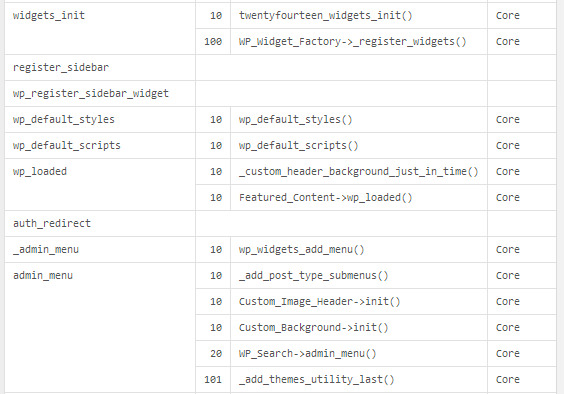
  • Which “caller” or function/hook is calling the query
  • Gives a trace of which piece of code is calling it
  • Gives a trace of any dependencies and conditionals being met by queries executed on the page
  • Provides a breakdown of how much time it took for all queries to run
  • How much Memory the page used in being generated
  • The percentage of queries that were served from Object Cache.
  • Which scripts are being run, their position on the page and a trace of which files the scripts are triggered from
  • It also detects any PHP Warnings or Errors generated by the page
  • Gives a report of the server the site is running on:
    • PHP version
    • Max_execution_time
    • Memory allotted to WordPress
    • Database being used
    • query_cache_limit (Object Cache)
    • Debugging information

All this data can be extremely helpful to developers looking to optimize their sites!

On top of the extra data it generates, it can be run on the front end without being logged in by setting a specific cookie (this setting is available at the bottom of the report when logged in initially). So in addition to debugging, this information can also help developers understand what conditionals and hooks their own code should hook into, to function properly.

Caveats

There are also some caveats to understand when using Query Monitor on some hosts and environments. These are some common errors to look out for:

  • Query cache: Query Monitor is checking to see if “mysql_query_cache” is being used. WP Engine and some other hosts use a separate service for query caching, called Object Cache. As a result, some of the information may lead you to believe that queries are not being cached, when in fact they are (as long as Object Cache is enabled). The cached percentage at the top of the report will still report this accurately.
  • Query Monitor was unable to symlink its db.php file into place: This error means that the Query Monitor is trying to symlink its own db.php file within its plugin directory to wp-content/db.php. Many webhosts will already have the db.php file in the wp-content directory, so often times this is a red herring.
  • Query Monitor on clustered environments: On clusters and redundant environments with multiple web servers, the requests that Query Monitor is tracking are run from the web servers of the cluster. However, in these environments MySQL is usually only run in READ only mode there. MySQL passes all write operations to the database master server. This conflicts with the code of Query Monitor, so it doesn’t work properly on these environments. In these cases, making a copy of your site to a single-server environment to test is best practice.

Making Sense of Google PageSpeed Scores

What is Google PageSpeed Insights?

If you’ve invested some time into making sure your site is performing well with your users, you’ve likely used the Google PageSpeed Insights tester to see how your site stacks up. This tool measures your site against a series of metrics and standards that it uses to help rank sites internet-wide. And, if you’re one of the many users of Google’s Adsense ads, this score directly affects the quality of the ads your site gets.

Unfortunately, Google PageSpeed Insights doesn’t get very verbose about why it ranked your site the way it did. And the suggestions can be hard to interpret if you’re not used to SEO and optimization terms. Not to worry, I’m here to break it down for you!


Avoid landing page redirects

This recommendation is pretty simple. It just means don’t redirect your home page to another page, either for desktop or mobile users. So for example, using a separate domain like “m.mysite.com” for mobile requests is actually less beneficial for SEO and less satisfying for users. Keep in mind with WordPress, most themes are automatically “responsive.” This means they already have built-in mobile support, without having to have an entirely separate site or domain for these users.

Also remember to check your site’s home page when testing with Google PageSpeed Insights. If your domain in the URL bar is “https://mysite.com/” then be sure to test that exact URL. Be sure you use the proper http:// or https:// version, and the correct “www” or “non-www” version.

Leverage browser caching

If Google PageSpeed Insights recommends this to you, be sure you check the resource it’s referencing. Is this resource called from your domain? Or is the resource called from another site? Some common examples are Google fonts, Google analytics tracking, or external API calls. If the resource is called from your own site, this means the request did not contain a header that said the web browser should cache that file or page. This means visitors to your site are having to request a new version from the server every time they visit the page. It’s best practice to include a “Cache-Control” header on the site that looks like this:

If you host with WP Engine, their platform configures page and static file caching for you automatically, so you don’t have to worry about adding these headers. Using a page caching plugin like W3 Total Cache or WP Super Cache will help you configure these headers if you don’t have a web host that configures this automatically.

When the resources showing in the details are not loading from your site’s URL, this score can be trickier to improve. However, the plugin Above the Fold Optimization has a setting that might help, called “External resource proxy” which will proxy those external resources to load from your own domain, and add the “Cache-Control” header.

Enable compression

Enabling compression is generally referring to gzip compression, which is a method of HTTP compression. For a comprehensive look at what gzip is and how it works, check out Torque’s handy guide. On WP Engine they configure this for you already at the server level. However, for other hosts you may have to either manually configure this in the .htaccess file, or use a plugin.W3 Total Cache offers “HTTP compression” which helps configure this for you in the .htaccess file. You can also use a plugin more specifically made for this task, like Check and Enable GZIP Compression.

Minify HTML, CSS, and/or Javascript

These warnings will show up if your CSS, Javascript, or HTML files referenced by your home page are not “minified.” Minification is the process of compressing and combining these files by taking out extra whitespace, comments, and formatting that might be adding to the time it takes your web browser to parse the response. The Autoptimize and BWP Minify plugins are both well-known plugins that specialize in minifying these assets on your site.

Eliminate render-blocking JavaScript and CSS in above-the-fold content

This can be one of the most confusing messages to receive when testing your site. To understand this message, you first have to understand what Above the Fold content is, and what would be considered “render blocking” JavaScript. In short, “Above the Fold” refers to what your user can see on their visible browser window (without scrolling down). It’s a legacy term that stems from the days of newspapers, where companies would have to strategically plan what would show above the literal fold of the newspaper.

As for “render blocking,” this is referring to JavaScript and CSS files that are being required to load before the site can start showing content. Until these assets are downloaded and processed by your web browser, you’ll see a blank white page. These assets are literally blocking your users from seeing your site’s content faster! If you use a tool like WebPageTest you can get a more clear view of this in action:

So how do you fix “render blocking” assets? You can use Above the Fold Optimization for this as well. The plugin has an option to “extract full CSS,” which you can then enter into a Critical CSS extractor to find what really needs to load before the page can render. The remaining assets can be deferred to the footer using the plugin’s settings!

Prioritize visible content

This warning goes hand-in-hand with the “Above the Fold” and “Render Blocking” warnings above. It just means you should only load Above the Fold content before the page render, and nothing more. You can use a Lazy Loading plugin to help with this, or Above the Fold Optimization has a setting for this as well.

Optimize images

You’ll see this warning if your site’s images have the potential to be “losslessly” compressed. This means eliminating extra metadata associated with those images, and compressing the image size without sacrificing image quality. Two of the most popular plugins for this are WP Smush, and EWWW Image Optimizer Cloud. Usually image compression plugins will have at least a small cost to perform the optimization. If you’re not wild on the idea of optimizing your images, you can alternatively compress the images locally and re-upload them.

Reduce server response time

Google PageSpeed insights will register this warning if your “Time to First Byte” is registering at .3 seconds or higher. Time to First Byte can be a confusing metric to understand! But most often, this comes down to optimizing your site’s PHP code and queries. Check out TTFB and PHP for more information about troubleshooting TTFB.


There you have it! Some quick and easy ways to increase your Google PageSpeed scores. And along the way, we’ve covered some background on what they mean in the context of WordPress. Using these insights you can take your site’s browser performance and SEO to the next level!

4 Important Ways to Identify a Botnet

What is a botnet?

A botnet is a series of internet devices (computers, websites, servers, modems, mobile phones, and more) infected with malware, harnessed together. Their purpose is to infect more devices with malware to build their network even further.

Botnets are sometimes very hard to identify because of their nature to switch IP addresses frequently, so as to not trigger security software to take action. Furthermore, botnets can “spoof” legitimate browsers in their requests, making it seem like the request is coming from a normal web browser or mobile phone.

These attributes aside, there are still a few key tricks you can use to identify a botnet.

Bots don’t load assets

Try visiting your site, then look through your site’s access logs. Locate the requests associated with your IP address. Do you see a “GET /” entry in the log? You should! But you should also see a number of static files requested after that, like requests for your theme’s CSS and JavaScript files.

One key attribute of botnets is that they do not load these CSS and JavaScript files. For these you will ONLY see a “GET /” entry, but no static files requested. What’s tricky about this is because botnets don’t load Javascript, these visits to your site are invisible on your Google Analytics reports. You’ll need access to logs from your site’s server itself to identify a botnet.

Bots make illegitimate POST requests

Another way to identify a botnet is to look at the behavior of the IP address: they will often try to make “POST” requests instead of just “GET” requests. A POST request is a request intended to update information, or login to a site. In WordPress, the most common places for this would be your /wp-login.php page, and your /xmlrpc.php page.

The /wp-login.php page is where you and your site authors will log into your WordPress site. A POST request here comes from someone trying to log into the site. On WP Engine, POST requests to the login page without loading the page’s assets are blocked, meaning you are safe from being infected by malware. But, these botnets may be bothersome all the same for various reasons.

Similarly, the /xmlrpc.php page is another page targeted by botnets. This page only accepts POST requests from mobile posting apps, so that you can remotely update your site. Botnets will target these pages in hopes of some kind of security exploit, so they can infect your site and server with malware. On WP Engine, requests to XMLRPC are only accepted from legitimate users on your site, which is another way they protect you from this kind of traffic.

Bots may spoof “fake” browser versions

In your site’s access logs, you’ll generally see entries like this:

172.56.7.237 techgirlkb.guru - [07/Aug/2017:02:32:11 +0000] "GET /2017/08/quick-wins-database-optimization/ HTTP/1.1" 200 9064 "http://m.facebook.com/" "Mozilla/5.0 (Linux; Android 7.1.2; Pixel XL Build/NKG47M; wv) AppleWebKit/537.36 (KHTML, like Gecko) Version/4.0 Chrome/59.0.3071.125 Mobile Safari/537.36 [FB_IAB/FB4A;FBAV/135.0.0.22.90;]; WPEPF/1"

This section in quotes “Mozilla/5.0 (Linux; Android 7.1.2; Pixel XL Build/NKG47M; wv) AppleWebKit/537.36 (KHTML, like Gecko) Version/4.0 Chrome/59.0.3071.125 Mobile Safari/537.36 [FB_IAB/FB4A;FBAV/135.0.0.22.90;]; WPEPF/1” is the “user agent string” for the request that came in. Normally with a long string like this, it looks like a pretty legitimate user. But often times, botnets will use a user agent string that looks legitimate, but is just slightly off. Here’s an example of one I see a lot:

"Mozilla/5.0 (Windows NT 6.1; WOW64; rv:40.0) Gecko/20100101 Firefox/40.1"

This one is really tricky. Based on the results of my user agent string lookup, it appears to be a Windows 7 user, using Firefox version 40.1 as a web browser. Only, Firefox doesn’t have a version 40.1. You can find the real versions of Firefox on their website. This is another way in which it can be hard to identify a botnet: they evade normal security software and firewalls by pretending to be legitimate user agents.

Botnets will change IPs after an invalid response

Last, the other key behavioral trait of a botnet is that it will rotate IP addresses. Usually this happens when the botnet detects it’s been blocked. For instance, if it receives an empty response or a 403 Forbidden response, this signals the botnet that it’s time to move on to a different IP address from another one of its malware-infected devices in the network.

There are several known Internet Service Providers and cell carriers whose devices are most vulnerable to this kind of botnet and to malware. You can read more about it in this comprehensive study done by WordFence. You’ll notice if you do an IP lookup for the IP addresses making these requests, that most are from obscure countries, with the same telecom provider.

One way you can battle the rotating IP addresses is by limiting the traffic allowed to your site to only countries you know to be legitimate. Or (if that’s going to be a really long list), you can alternatively block traffic from the countries you see these botnet requests originating from.

Quick Wins for Database Optimization

When developers think about optimizing their sites, database optimization isn’t always the first thing to come to mind. And yet, a few simple steps and considerations are all you need to make a large difference in performance and user experience.

Why are databases important?

Systems like WordPress use PHP code to generate the pages requested on your site. The PHP code communicates with a database full of options, page IDs, user information and more to help create that page. Often times one of the slowest parts of the page generation process is running queries to your database, and waiting for the results. So any optimizations made to your database can help your page speed, as well as the weight it carries on the server.

Object Cache

In WordPress, the core code has a class called Object Cache, which is meant to store repeated query results and offload some of the work to serve those requests to cache. By default though, the Object Cache class is not persistent, meaning it doesn’t span multiple user sessions. To truly make the most of caching, its best to implement a service like Memcached to allow for persistent Object Caching. Memcached will store the repeated query results in virtual Memory, making the results return lightning fast.

InnoDB vs MyISAM

MyISAM is a legacy type of table storage engine. When a table is formatted in MyISAM, any query run to a row in that table will cause the entire table to lock until the query completes. This is known as “table-level locking.” When multiple queries are run to the table simultaneously, one will inevitably fail because the full table is locked. While MyISAM might work well for databases that only need to support “read” operations, it is not ideal for writes!

Enter InnoDB. InnoDB is a more modern table storage engine format. It’s the best format to use for production databases, providing speed and reliability for both read and write operations. Unlike MyISAM, it allows for row-level locking. And, many servers will have a buffer pool of Memory dedicated specifically to database processes. MyISAM tables can’t be stored in this Memory pool, meaning often times queries to these tables end up writing to swap instead.

So you just looked at your database, and you discovered *gasp* MyISAM tables! Now what? Simple! You can reformat those tables to InnoDB. Follow this guide for more help. Once they’re converted, your queries will run faster and can use the Memory dedicated to InnoDB.

Reduce Autoloaded Data

In WordPress, your wp_options table contains a column called “autoload.” This column tells WordPress whether the data in the corresponding row needs to load on every single page load. A lot of plugins and themes add rows to this table, defaulting to “yes” in that column. And let’s be honest: no, every logged 404 on your site does not need to load on every page. There is some important stuff there though, like your site’s home/siteurl, theme, theme settings, and so on. So it’s good practice to look through this table and see whether the items you’re autoloading really need to be autoloaded. Try this query to locate the longest rows in your wp_options table:

SELECT LENGTH(option_value),option_name FROM wp_options WHERE autoload='yes' ORDER BY length(option_value) DESC LIMIT 20;

Look at the top rows of autoloaded data, and see if there’s any options listed that don’t need to be loaded on every page. If not, set that option’s autoload column to “no” instead.

Get rid of orphaned metadata

When you delete a post, page, image, or comment in WordPress, it removes the post entry from your wp_posts or wp_comments table. But it leaves behind all the data associated with that entry in the wp_postmeta or wp_commentmeta table. Depending on the amount of attributes associated with each entry, this could add up to a lot of “orphaned” metadata that’s simply no longer needed! Try these queries to find the total amounts of orphaned metadata:

SELECT COUNT(pm.meta_id) as row_count FROM wp_postmeta pm LEFT JOIN wp_posts wp ON wp.ID = pm.post_id WHERE wp.ID IS NULL;
SELECT COUNT(*) as row_count FROM wp_commentmeta WHERE comment_id NOT IN (SELECT comment_id FROM wp_comments);

And try these queries to delete those orphaned entries:

DELETE pm FROM wp_postmeta pm LEFT JOIN wp_posts wp ON wp.ID = pm.post_id WHERE wp.ID IS NULL;
DELETE FROM wp_commentmeta WHERE comment_id NOT IN (SELECT comment_id FROM wp_comments);

Optimize tables

Every few months it’s a good idea to Optimize your tables in MySQL. This action will help reorganize your table and get rid of any wasted space. It will also rebuild the indexes on the table, meaning full table searches will run faster. Read more about optimizing InnoDB databases in MySQL’s documentation.

Add more resources

Last, remember that it’s best practice to ensure all your active tables actually fit in the Memory you have allocated to InnoDB. If you have 1GB Memory dedicated to InnoDB and you have a 6GB database, chances are that you can’t trim your database down enough to fit in that buffer pool. You are simply going to need more Memory. At this point it’s best to have a conversation with your team. It’s time to upgrade your server resources to support your database usage.

Cookies, Sessions, and Persistent Caching

The Conflict

A common issue when developing a website comes when your site has a need for page cache, but also a need for user sessions using cookies. PHP Sessions conflict with page caching, and here’s why:

When a user visits your site, they request a page. The page request is sent to the server, where your PHP code is executed to generate the page. The PHP code is where you’d set any specific PHP Session variables, and also any actions to take place based on the presence of these cookies and sessions. For the first user to your site, this is no problem. The PHP code is requested and executed as normal! But on the way to serve the request to your user, the server stores a copy of the generated HTML in page cache.

Enter the conflict: with page caching, the second user to come to your site within your caching timeframe gets served the cached version of the page. The request never makes it back to WordPress/PHP to process the code again. So your cookies and sessions aren’t set, and your actions based on cookies present aren’t executed.

Decision Time

In this situation, you have to make a decision: Is a cookie or a PHP Session really the right course of action for what you’re trying to accomplish? If the answer is yes, you’ll need to make Page Cache exemptions on your site in order to get things working. This means extra traffic going to this page could cause high server load, and could take longer to process.

If the answer is no, consider other options: Can you perform the action you want with Javascript? Admin-ajax requests? Whenever possible, dynamic content should load with Javascript so that it can still run lightweight on your server, and take advantage of page cache. If this simply isn’t possible, go ahead and uncache the page. But, rest assured that if you use Object Cache to cache repeated query results, at least this caching layer will still be present to cache the results of the queries run on these pages.

What is Above the Fold Content?

If you use many performance testing tools like Google PageSpeed Insights and GTMetrix, you might run across a recommendation: “Optimize Delivery of Above the Fold Content.” So what is Above the Fold Content anyway? And how can you optimize it?

Defining Above the Fold

“Above the Fold” is an industry term for files and content that has to load before your page can start displaying anything. It means the content above the bottom of your visitor’s browser window. Until your “Above the Fold” items have loaded, the user simply sees a blank page. Prioritizing what items load “Above the Fold” and what items can load later on is one of the important steps in optimizing your site for a faster browser load time.

What goes Above the Fold?

Most importantly, you want your site’s “Critical CSS” to load “Above the Fold” – this CSS is the styling information from your theme (and possibly plugins). There may be other CSS files that aren’t as important to load up front though – for instance, styles for your footer (often “Below the Fold”), or styles for certain features or widgets. You can use a tool like Above the Fold Optimization to extract your site’s CSS, and then use a “Critical CSS” extractor to find what should be prioritized first.

What shouldn’t go Above the Fold?

Most often, JavaScript shouldn’t have to load before your site can begin rendering. Since JavaScript usually controls an action like a popup, autoscroll, or loading more content, those files can needlessly bulk up your Above the Fold content. Whenever possible, these files should be deferred to load in the footer instead. The one primary exception to this rule is with sliders: the jQuery files that control the slider need to be loaded Above the Fold in order to properly rotate the slider images.

How can I see what’s loaded Above the Fold on my site?

Use a testing tool that offers a waterfall view, like WebPageTest or Pingdom. Look at what is being loaded before the “start render” line to see what is critical. If it’s not critical, defer it! If it is critical, be sure to minify it so the browser can read it easily.

  • « Previous Page
  • Page 1
  • …
  • Page 5
  • Page 6
  • Page 7
  • Page 8
  • Next Page »

Footer

Categories

  • Ansible
  • AWS
  • Git
  • Linux
  • Optimization
  • Performance
  • PHP
  • Scalability
  • Security
  • Uncategorized
  • WordPress

Copyright © 2025 · Atmosphere Pro on Genesis Framework · WordPress · Log in