• Skip to main content
  • Skip to footer

TechGirlKB

Performance | Scalability | WordPress | Linux | Insights

  • Home
  • Speaking
  • Posts
    • Linux
    • Performance
    • Optimization
    • WordPress
    • Security
    • Scalability
  • About Janna Hilferty
  • Contact Me

Linux

NPM: No user exists for uid 1000

I thought I would write a quick post about this issue, as I’ve encountered it several times. Note, this user could be any ID, not just 1000 or 1001, etc. — it all depends on what user has launched your build container from your deployment software.

The issue: When performing a build step with npm in a Docker container, it throws this error on git checkouts:

npm ERR! Error while executing:
npm ERR! /usr/bin/git ls-remote -h -t ssh://[email protected]/repo.git
npm ERR! 
npm ERR! No user exists for uid 1000
npm ERR! fatal: Could not read from remote repository.
npm ERR! 
npm ERR! Please make sure you have the correct access rights
npm ERR! and the repository exists.
npm ERR! 
npm ERR! exited with error code: 128
 
npm ERR! A complete log of this run can be found in:
npm ERR!     /root/.npm/_logs/2023-05-08T19_50_34_229Z-debug.log

What was equally frustrating was that in testing the same command in the same container locally (instead of inside our deployment tools), it had no issues.

What causes this issue?

The crux of the issue is this: When NPM/node is trying to checkout from git, it uses the permissions of the node_modules or package.json configurations to determine which user should be used to pull git packages.

When you’re mounting the Docker container to your build/deploy tool, the user owning the files there might not exist in your container. And it also might not be the user that you want to be checking out the files either! By default, like it or not, Docker logs you into the container as “root” user.

So to summarize:

  • Docker logs you in as root to perform the npm build commands
  • The files you’ve mounted into the container might be owned by a user that only exists on the deployment server and not inside the Docker container
  • NPM defaults to use the owner of the node_modules files to choose which user it should use to perform git/ssh commands
  • This results in the error that the user does not exist

The fix

The fix in this case is just to perform a “chown” of the files you’ve mounted from the deployment server prior to running your npm build commands.

For example, given the scenario that I’ve mounted my files to /source on the container, and my build files are now inside /source/frontend:

$ chown -R root:root /source/frontend/; cd /source/frontend && npm run build 

You can replace the path and the npm command with whatever your npm build script is for your own environment. The important part is the change of the ownership at the beginning of the command.


Have you had issues with this error in NPM? Have experiences you want to share? Feel free to leave a comment, or contact me.
How to Create CIS-Compliant Partitions on AWS

If you use CIS (Center for Internet Security) ruleset in your security scans, you may need to create a partitioning scheme in your AMI that matches the recommended CIS rules. On AWS this becomes slightly harder if you use block storage (EBS). In this guide I’ll show how to create a partitioning scheme that complies with CIS rules.

Prerequisites:

  • AWS account
  • CentOS 7 operating system

CIS Partition Rules

On CentOS 7, there are several rules for partitions which both logically separate webserver-related files from things like logs, and limit execution of files (like scripts, or git clones, for example) in directories accessible by anyone (such as /tmp, /dev/shm, and /var/tmp).

The rules are as follows:

  • 1.1.2 Ensure separate partition exists for /tmp 
  • 1.1.3 Ensure nodev option set on /tmp partition 
  • 1.1.4 Ensure nosuid option set on /tmp partition 
  • 1.1.5 Ensure noexec option set on /tmp partition 
  • 1.1.6 Ensure separate partition exists for /var 
  • 1.1.7 Ensure separate partition exists for /var/tmp 
  • 1.1.8 Ensure nodev option set on /var/tmp partition 
  • 1.1.9 Ensure nosuid option set on /var/tmp partition 
  • 1.1.10 Ensure noexec option set on /var/tmp 
  • 1.1.11 Ensure separate partition exists for /var/log 
  • 1.1.12 Ensure separate partition exists for /var/log/audit
  • 1.1.13 Ensure separate partition exists for /home 
  • 1.1.14 Ensure nodev option set on /home partition 
  • 1.1.15 Ensure nodev option set on /dev/shm partition
  • 1.1.16 Ensure nosuid option set on /dev/shm partition
  • 1.1.17 Ensure noexec option set on /dev/shm partition

Below I’ll explain how to create a partition scheme that works for all the above rules.

Build your server

Start by building a server from your standard CentOS 7 AMI (Amazon Machine Image – if you don’t have one yet, there are some available on the Amazon Marketplace).

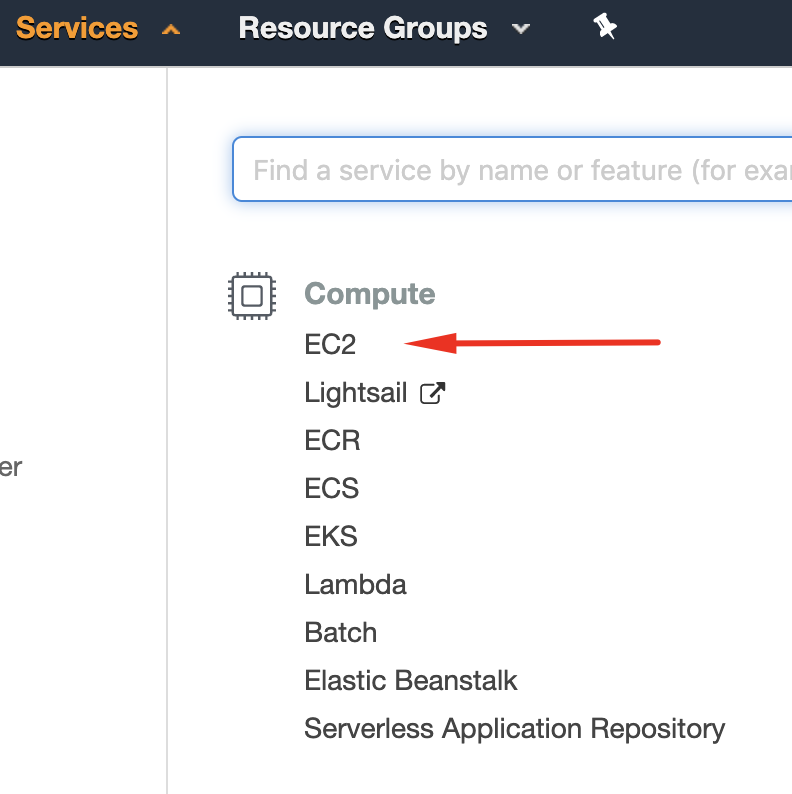
Sign in to your Amazon AWS dashboard and select EC2 from the Services menu.

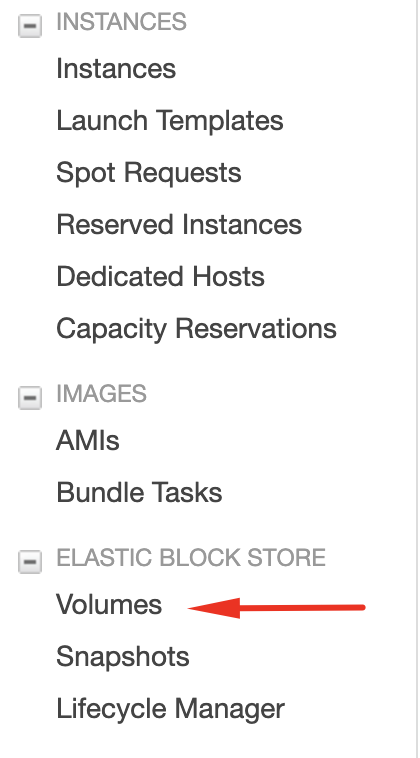
In your EC2 (Elastic Compute Cloud dashboard), select the “Launch Instance” menu and go through the steps to launch a server with your CentOS 7 AMI. For ease of use I recommend using a t2-sized instance. While your server is launching, navigate to the “Volumes” section under the Elastic Block Store section:

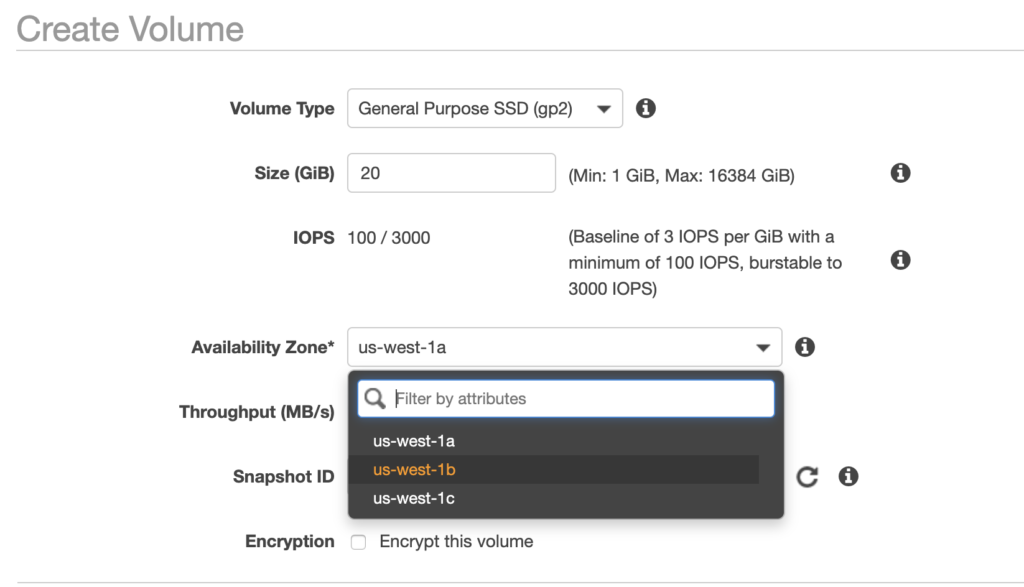
Click “Create Volume” and create a basic volume in the same Availability Zone as your server.

After the volume is created, select it in the list of EBS volumes and select “Attach volume” from the dropdown menu. Select your newly-created instance from the list, and make sure the volume is added as /dev/sdf. *

*This is important – if you were to select “/dev/sda1” instead, it would try to attach as the boot volume, and we already have one of those attached to the instance. Also note, these will not be the names of the /dev/ devices on the server itself, but we’ll get to that later.

Partitioning

Now that your server is built, login via SSH and use sudo -i to escalate to the root user. Now let’s check which storage block devices are available:

# lsblk
NAME MAJ:MIN RM SIZE RO TYPE MOUNTPOINT
xvda 259:0 0 20G 0 disk
└─xvda1 259:1 0 20G 0 part /
xvdf 259:2 0 20G 0 disk

If you chose t2 instance sizes in AWS, you likely have devices “xvda” and “xvdf,” where “xvdf” is the volume we manually added to the instance. If you chose t3 instances you’ll likely see device names like nvme0n1 instead. These devices are listed under dev on your instance, for reference.

Now we’ll partition the volume we added using parted.

# parted /dev/xvdf 
(parted) p
Model: Xen Virtual Block Device (xvd)
Disk /dev/xvdf: 18432MiB
Sector size (logical/physical): 512B/512B
Partition Table: gpt
Disk Flags:

Number Start End Size File system Name Flags

(parted) mklabel gpt
(parted) mkpart vartmp ext4 2MB 5%
(parted) mkpart swap linux-swap 5% 10%
(parted) mkpart home ext4 10% 15%
(parted) mkpart usr ext4 15% 45%
(parted) mkpart varlogaudit ext4 45% 55%
(parted) mkpart varlog ext4 55% 65%
(parted) mkpart var ext4 65% 100%
(parted) unit GiB
(parted) p
Model: Xen Virtual Block Device (xvd)
Disk /dev/xvdf: 18.0GiB
Sector size (logical/physical): 512B/512B
Partition Table: gpt
Disk Flags:

Number Start End Size File system Name Flags
1 0.00GiB 1.00GiB 1.00GiB ext4 vartmp
2 1.00GiB 2.00GiB 1.00GiB linux-swap(v1) swap
3 2.00GiB 4.00GiB 2.00GiB ext4 home
4 4.00GiB 9.00GiB 5.00GiB ext4 usr
5 9.00GiB 11.0GiB 2.00GiB ext4 varlogaudit
6 11.0GiB 12.4GiB 1.40GiB ext4 varlog
7 12.4GiB 20.0GiB 7.60GiB ext4 var

(parted) align-check optimal 1
1 aligned
(parted) align-check optimal 2
2 aligned
(parted) align-check optimal 3
3 aligned
(parted) align-check optimal 4
4 aligned
(parted) align-check optimal 5
5 aligned
(parted) align-check optimal 6
6 aligned
(parted) align-check optimal 7
7 aligned
(parted) quit
Information: You may need to update /etc/fstab

Now when you run lsblk you’ll see the 7 partitions we created:

# lsblk 
NAME MAJ:MIN RM SIZE RO TYPE MOUNTPOINT
xvda 202:0 0 20G 0 disk
└─xvda1 202:1 0 20G 0 part /
xvdf 202:80 0 18G 0 disk
├─xvdf1 202:81 0 3.6G 0 part
├─xvdf2 202:82 0 922M 0 part
├─xvdf3 202:83 0 922M 0 part
├─xvdf4 202:84 0 4.5G 0 part
├─xvdf5 202:85 0 921M 0 part
├─xvdf6 202:86 0 1.8G 0 part
└─xvdf7 202:87 0 5.4G 0 part

After you’ve run through the steps above, you’ll have created the partitions, but now we need to mount them and copy the correct directories to the proper places.

First, let’s make the partitions filesystems using mkfs. We’ll need to do this for every partition except the one for swap! Note that we’re leaving out partition ID 2 in our loop below, which was the swap partition. After creating the filesystems, we’ll use mkswap to format our swap partition. Note also that you may need to change the “xvdf” parts to match the name of your secondary filesystem if it’s not xvdf.

# for I in 1 3 4 5 6 7; do mkfs.ext4 /dev/xvdf${I}; done
# mkswap /dev/xvdf2

Next, we’ll mount each filesystem. Start by creating directories (to which we will sync files from their respective places in existing the filesystem). Again, if your filesystem is not “xvdf” please update the commands accordingly before running.

# mkdir -p /mnt/vartmp /mnt/home /mnt/usr /mnt/varlogaudit /mnt/varlog /mnt/var
# mount /dev/xvdf1 /mnt/vartmp
# mount /dev/xvdf3 /mnt/home
# mount /dev/xvdf4 /mnt/usr
# mount /dev/xvdf5 /mnt/varlogaudit
# mount /dev/xvdf6 /mnt/varlog
# mount /dev/xvdf7 /mnt/var

Now, we’ll sync the files from their existing places, to the places we’re going to be separating into different filesystems. Note, for the tricky ones that are all in the same paths (/var, /var/tmp, /var/log, and /var/log/audit), we have to exclude the separated directories from the sync and create them as empty folders with the default 755 directory permissions.

# rsync -av /var/tmp/ /mnt/vartmp/ 
# rsync -av /home/ /mnt/home/
# rsync -av /usr/ /mnt/usr/
# rsync -av /var/log/audit/ /mnt/varlogaudit/
# rsync -av --exclude=audit /var/log/ /mnt/varlog/
# rsync -av --exclude=log --exclude=tmp /var/ /mnt/var/
# mkdir /mnt/var/log
# mkdir /mnt/var/tmp
# mkdir /mnt/var/log/audit
# mkdir /mnt/varlog/audit
# chmod 755 /mnt/var/log
# chmod 755 /mnt/var/tmp
# chmod 755 /mnt/var/log/audit
# chmod 755 /mnt/varlog/audit

Last, to create the /tmp partition in the proper way, we need to take some additional steps:

# systemctl unmask tmp.mount  
# systemctl enable tmp.mount
# vi /etc/systemd/system/local-fs.target.wants/tmp.mount

Inside the /etc/systemd/system/local-fs.target.wants/tmp.mount file, edit the /tmp mount to the following options:

[Mount]  
What=tmpfs
Where=/tmp
Type=tmpfs
Options=mode=1777,strictatime,noexec,nodev,nosuid

Now that the files are in the proper mounted directories, we can edit the /etc/fstab file to tell the server where to mount the files upon reboot. To do this, first, we’ll need to get the UUIDs of the partitions we’ve created:

# blkid 
/dev/xvda1: UUID="f41e390f-835b-4223-a9bb-9b45984ddf8d" TYPE="xfs" /dev/xvdf1: UUID="dbf88dd8-32b2-4cc6-aed5-aff27041b5f0" TYPE="ext4" PARTLABEL="vartmp" PARTUUID="5bf3e3a1-320d-407d-8f23-6a22e49abae4"
/dev/xvdf2: UUID="238e1e7d-f843-4dbd-b738-8898d6cbb90d" TYPE="swap" PARTLABEL="swap" PARTUUID="2facca1c-838a-4ec7-b101-e27ba1ed3240"
/dev/xvdf3: UUID="ac9d140e-0117-4e3c-b5ea-53bb384b9e3c" TYPE="ext4" PARTLABEL="home" PARTUUID="e75893d8-61b8-4a49-bd61-b03012599040"
/dev/xvdf4: UUID="a16400bd-32d4-4f90-b736-e36d0f98f5d8" TYPE="ext4" PARTLABEL="usr" PARTUUID="3083ee67-f318-4d8e-8fdf-96f7f06a0bef" /dev/xvdf5: UUID="c4415c95-8cd2-4f1e-b404-8eac4652d865" TYPE="ext4" PARTLABEL="varlogaudit" PARTUUID="37ed0fd9-8586-4e7b-b42e-397fcbf0a05c"
/dev/xvdf6: UUID="a29905e6-2311-4038-b6fa-d1a8d4eea8e9" TYPE="ext4" PARTLABEL="varlog" PARTUUID="762e310e-c849-48f4-9cab-a534f2fad590"
/dev/xvdf7: UUID="ac026296-4ad9-4632-8319-6406b20f02cd" TYPE="ext4" PARTLABEL="var" PARTUUID="201df56e-daaa-4d0d-a79e-daf30c3bb114"

In your /etc/fstab file, enter (something like) the following, replacing the UUIDs in this example with the ones in your blkid output. Be sure to scroll all the way over to see the full contents of the snippet below!

#
# /etc/fstab
# Created by anaconda on Mon Jan 28 20:51:49 2019
#
# Accessible filesystems, by reference, are maintained under '/dev/disk'
# See man pages fstab(5), findfs(8), mount(8) and/or blkid(8) for more info
#

UUID=f41e390f-835b-4223-a9bb-9b45984ddf8d / xfs defaults 0 0
UUID=ac9d140e-0117-4e3c-b5ea-53bb384b9e3c /home ext4 defaults,noatime,acl,user_xattr,nodev,nosuid 0 2
UUID=a16400bd-32d4-4f90-b736-e36d0f98f5d8 /usr ext4 defaults,noatime,nodev,errors=remount-ro 0 2
UUID=c4415c95-8cd2-4f1e-b404-8eac4652d865 /var/log/audit ext4 defaults,noatime,nodev,nosuid 0 2
UUID=a29905e6-2311-4038-b6fa-d1a8d4eea8e9 /var/log ext4 defaults,noatime,nodev,nosuid 0 2
UUID=ac026296-4ad9-4632-8319-6406b20f02cd /var ext4 defaults,noatime,nodev,nosuid 0 2
UUID=238e1e7d-f843-4dbd-b738-8898d6cbb90d swap swap defaults 0 0
UUID=dbf88dd8-32b2-4cc6-aed5-aff27041b5f0 /var/tmp ext4 defaults,noatime,nodev,nosuid,noexec 0 0
tmpfs /dev/shm tmpfs defaults,nodev,nosuid,noexec 0 0
tmpfs /tmp tmpfs defaults,noatime,nodev,noexec,nosuid,size=256m 0 0

If you were to type df -h at this moment, you’d likely have output like the following, since we mounted the /mnt folders:

# df -h 
Filesystem Size Used Avail Use% Mounted on
/dev/xvda1 20G 2.4G 18G 12% /
devtmpfs 1.9G 0 1.9G 0% /dev
tmpfs 1.9G 0 1.9G 0% /dev/shm
tmpfs 1.9G 17M 1.9G 1% /run
tmpfs 1.9G 0 1.9G 0% /sys/fs/cgroup
tmpfs 379M 0 379M 0% /run/user/1000
/dev/xvdf1 3.5G 15M 3.3G 1% /mnt/vartmp
/dev/xvdf3 892M 81M 750M 10% /mnt/home
/dev/xvdf4 4.4G 1.7G 2.5G 41% /mnt/usr
/dev/xvdf5 891M 3.5M 826M 1% /mnt/varlogaudit
/dev/xvdf6 1.8G 30M 1.7G 2% /mnt/varlog
/dev/xvdf7 5.2G 407M 4.6G 9% /mnt/var

But, after a reboot, we’ll see those folders mounted as /var, /var/tmp, /var/log, and so on. One more important thing: If you are using selinux, you will need to restore the default file and directory contexts — this prevents you from being locked out of SSH after a reboot!

# touch /.autorelabel;reboot

Wait a few minutes, and then SSH in to your instance once more. Post-reboot, you should see your folders mounted like the following:

# df -h
Filesystem Size Used Avail Use% Mounted on
devtmpfs 1.9G 4.0K 1.9G 1% /dev
tmpfs 1.9G 0 1.9G 0% /dev/shm
tmpfs 1.9G 25M 1.9G 2% /run
tmpfs 1.9G 0 1.9G 0% /sys/fs/cgroup
/dev/xvda1 20G 5.7G 15G 29% /
/dev/xvdf4 4.8G 2.6G 2.0G 57% /usr
/dev/xvdf7 7.4G 577M 6.4G 9% /var
/dev/xvdf3 2.0G 946M 889M 52% /home
/dev/xvdf1 991M 2.6M 922M 1% /var/tmp
/dev/xvdf6 1.4G 211M 1.1G 17% /var/log
/dev/xvdf5 2.0G 536M 1.3G 30% /var/log/audit
tmpfs 256M 300K 256M 1% /tmp
tmpfs 389M 0 389M 0% /run/user/1002
tmpfs 389M 0 389M 0% /run/user/1000

Voila! You’ve successfully created partitions that are compliant with CIS rules. From here you can select your instance in the EC2 dashboard, click “Actions” > “Stop,” and then “Actions” > “Image” > “Create Image” to create your new AMI using these partitions for use going forward!

Please note, I’ve done my best to include information for other situations, but these instructions may not apply to everyone or every template you may use on AWS or CentOS 7. Thanks again, and I hope this guide helps!

Installing Varnish on Ubuntu

In a few of my posts I’ve talked about the benefits of page cache systems like Varnish. Today we’ll demonstrate how to install it! Before continuing, be aware that this guide assumes you’re using Ubuntu on your server.

Why use Varnish?

Firstly, let’s talk about why page cache is fantastic. For dynamic page generation languages like PHP, the amount of server processing power it takes to build a page compared to serving a static file (like HTML) is substantially more. Since the page has to be rebuilt with each new user to request it, the server does a lot of redundant work. But this also allows for more customization to your users since you can tell the server to build the page differently based on different conditions (geolocation, referrer, device, campaign, etc).

That being said, using persistent page cache is an easy way to get the best of both worlds: cache holds onto a static copy of the page that was generated for a period of time, and then the page can be built as new whenever the cache expires. In short, page cache allows your pages to load in a few milliseconds rather than 1+ full seconds.

Installing Varnish

To install Varnish on a system using Ubuntu, you’ll use the package installer. While logged into your server (as a non-root user), run the following:

sudo apt install varnish

Be sure the Varnish service is stopped while you configure it! You can stop the Varnish service like this:

sudo systemctl stop varnish

Now it’s time to configure the Varnish settings. Make a copy of the default configuration file like so:

cd /etc/varnish
sudo cp default.vcl mycustom.vcl

Make sure Varnish is configured for the right port (we want port 80 by default) and the right file (our mycustom.vcl file):

sudo nano /etc/default/varnish
DAEMON_OPTS="-a :80 \
-T localhost:6082 \
-f /etc/varnish/mycustom.vcl \
-S /etc/varnish/secret \
-s malloc,256m"

Configuring Varnish

The top of your mycustom.vcl file should read like this by default:

backend default {
.host = "127.0.0.1";
.port = "8080";
}

This line defines the “backend,” or which port to which Varnish should pass uncached requests. Now we want to configure the web server to listen on the right port. Nginx will listen on port 8080 by default, but if you’re using Apache you may need to modify the port in your /etc/apache2/ports.conf file and /etc/apache2/sites-enabled/000-default.conf to reference port 8080.

From here you can begin to customize your configuration! You can tell Varnish what requests to add X-Group headers for, which pages to strip out cookies on, how and when to purge the cache, and more. You probably only want to cache GET and HEAD methods for requests, as POST requests should always be uncached. Here’s a basic rule that says to add a header saying not to cache anything that’s not GET and HEAD:

sub vcl_recv {
if (req.request != "GET" && req.request != "HEAD") {
set req.http.X-Pass-Method = req.request;
return (pass);
}
}

And here’s an excerpt which says not to cache anything with the path “wp-admin” (a common need for sites with WordPress):

sub vcl_recv
{
if (req.http.host == "mysite.com" &&
req.url ~ "^/wp-admin")
{
return (pass);
}
}

There’s a ton of other fun custom configurations you can add. To research the available options and experiment with them, check out the book from Varnish.

Once you’ve added in your customizations, be sure to start Varnish:

sudo systemctl start varnish

Now what?

Now you have Varnish installed and configured! Your site will cache pages and purge the cache based on the settings you’ve configured in the mycustom.vcl file. Using cache and caching heavily will heavily benefit your site performance. And, it’ll help your site scale to support more traffic at a time. Enjoy!


Have more questions about Varnish? Confused about how cache works? Any cool cache rules you use in your own environment? Let me know in the comments or contact me.

Preventing Site Mirroring via Hotlinking

Introduction

If you’re a content manager for a site, chances are one of your worst nightmares is having another site completely mirror your own, effectively “stealing” your site’s SEO. Site mirroring is the concept of showing the exact same content and styles as another site. And unfortunately, it’s super easy for someone to do.

How is it done?

Site mirroring can be accomplished by using a combination of “static hotlinking” and some simple PHP code. Here’s an example:

Original site:

site mirroring


Mirrored site:

site mirroring


The sites look (almost) exactly the same! The developer on the mirrored site used this code to mirror the content:

<?php
//get site content
        $my_site = $_SERVER['HTTP_HOST'];
        $request_url = 'http://philipjewell.com' . $_SERVER['REQUEST_URI'];
        $ch = curl_init();
        curl_setopt($ch, CURLOPT_URL, $request_url);
        curl_setopt($ch, CURLOPT_FOLLOWLOCATION, true);
        curl_setopt($ch, CURLOPT_RETURNTRANSFER, TRUE);
        $site_content = curl_exec($ch); //get the contents of the site from this server by curling it
        //get all the href links and replace them with our domain so they don't navigate away
        $site_content = preg_replace('/href=(\'|\")https?:\/\/(www\.)?philipjewell.com/', 'href=\1https://'.$my_site, $site_content);
        $site_content = preg_replace('/Philip Jewell Designs/', 'What A Jerk Designs', $site_content);
        echo $site_content;
?>

Unfortunately it’s super simple with just tiny bits of code to mirror a site. But, luckily there are some easy ways to protect your site against this kind of issue.

Prevent Site Mirroring

There are a few key steps you can take on your site to prevent site mirroring. In this section we’ll cover several prevention method options for both Nginx and Apache web servers.

Disable hotlinking

The first and most simple is to prevent static hotlinking. This essentially means preventing other domains from referencing static files (like images) from your site on their own. If you host your site with WP Engine, simply contact support via chat to have them disable this for you. If you host elsewhere, you can use the below examples to see how to disable static hotlinking in Nginx and Apache. Both links provide more context into what each set of rules does for further information.

Nginx (goes in your Nginx config file)

location ~* \.(gif|png|jpe?g)$ {
expires 7d;
add_header Pragma public;
add_header Cache-Control "public, must-revalidate, proxy-revalidate";
# prevent hotlink
valid_referers none blocked ~.google. ~.bing. ~.yahoo. server_names ~($host);
if ($invalid_referer) {
rewrite (.*) /static/images/hotlink-denied.jpg redirect;
# drop the 'redirect' flag for redirect without URL change (internal rewrite)
}
}
# stop hotlink loop
location = /static/images/hotlink-denied.jpg { }

Apache (goes in .htaccess file)

RewriteEngine on
RewriteCond %{HTTP_REFERER} !^$
RewriteCond %{HTTP_REFERER} !^http(s)?://(www\.)?yourdomain.com [NC]
RewriteCond %{HTTP_REFERER} !^http(s)?://(www\.)?google.com [NC]
RewriteCond %{HTTP_REFERER} !^http(s)?://(www\.)?bing.com [NC]
RewriteCond %{HTTP_REFERER} !^http(s)?://(www\.)?yahoo.com [NC]
RewriteRule \.(jpg|jpeg|png|gif|svg)$ http://dropbox.com/hotlink-placeholder.jpg [NC,R,L]


Disable CORS/Strengthen HTTP access control

The above steps will help prevent others from linking to static files on your site. However, you’ll also want to either disable CORS (Cross Origin Resource Sharing), or strengthen your HTTP access control for your site.

CORS is the ability for other sites to reference links to your own site in their source code. By disabling this, you’re preventing other sites from displaying content hosted on your own site. You can be selective with CORS as well, to only allow references to your own CDN URL, or another one of your sites. Or you can disable it entirely if you prefer.

According to OWASP guidelines, CORS headers allowing everything (*) should only be present on files or pages available to the public. To restrict the sharing policy to only your site, try using these methods:

.htaccess (Apache):

Access-Control-Allow-Origin: http://www.example.com

This allows only www.example.com to access your site. You can also set this to be a wildcard value, like in this example.

Nginx config (Nginx):

add_header 'Access-Control-Allow-Origin' 'www\.example\.com';

This says to only allow requests from www.example.com. You can also be more specific with these rules, to only allow specific methods from specific domains.

Disable iframes

Another step you may want to take is disabling the ability for others to create iframes from your site. By using iframes, some users may believe content on an attacker’s site is legitimately from your site, and be misled into sharing personal information or downloading malware. Read more about X-Frame-Options on Mozilla’s developer page.

Use “SAMEORIGIN” if you wish to embed iframes on your own site, but don’t want any other sites to display content. And use “DENY” if you don’t use iframes on your own site, and don’t want anyone else to use iframes from your site.

Block IP addresses

Last, if you’ve discovered that another site is actively mirroring your own, you can also block the site’s IP address. This can be done with either Nginx or Apache. First, find the site’s IP address using the following:

dig +short baddomain.com

This will print out the IP address that the domain is resolving to. Make sure this is the IP address that shows in your site’s Nginx or Apache access logs for the mirrored site’s requests.

Next, put one of the following in place:

Apache (in .htaccess file):

Deny from 123.123.123.123

Nginx (in Nginx config):

deny 123.123.123.123;


File a DMCA Takedown Notice

Last, if someone is mirroring your site without your explicit approval or consent, you may also want to take action by filing a DMCA Takedown Notice. You can follow this DMCA guide for more information. The guide will walk you through finding the host of the domain mirroring your own site, and filing the notice with the proper group.


Thank you to Philip Jewell for collaborating on this article! And thanks for tuning in. If you have feedback, additional information about blocking mirrored sites drop a line in the comments or contact me.

Deciphering Your Site’s Access Logs

Requirements

Searching your site’s access logs can be difficult! There’s a lot of information to visually take in, which means viewing the entire log entry can sometimes be overwhelming. In this article we’ll discuss ways to parse your access logs to better understand trends on your site!

Before we get started, let’s talk prerequisites. In order to use the bash commands we’ll discuss, you’ll need:

  • Apache and/or Nginx
  • SSH access to your server

Using grep, cut, sort, uniq, and awk

Before we dive into the logs themselves, let’s talk about how we’ll be parsing them. First, you’ll want to understand the bash commands we use to collect specific pieces of information from the logs.

cat

Used to “concatenate” two or more files together. In the case of searching access logs, we’d typically use it to print out results from two files together, to search for information in both. For example, if I wanted to print or search both today’s and yesterday’s logs.

zcat

Works the same as cat, but concatenates and prints out results of gzip (.gz) compressed files specifically.

grep

Use to search for a specific string or quote in a single file.

ack-grep

Used to find strings in a file or several files. The ack-grep command is more efficient than grep when looking for results in a directory or multiple files. And, unlike a standard grep, ack-grep prints out the specific line in which the text string was found. It’s also easier to only search in files of a specific kind, like PHP files for example.

cut

Used to cut out specific pieces of information, useful for sorting through grep results. Using the -d flag you can set a “delimiter” (dividing signal). And using the -f flag you can choose which field(s) separated by said delimiter to print out specifically.

sort

Sorts output results from lowest to highest, useful for sorting grep and cut results. You can use sort -rn to show results from highest to lowest instead.

uniq

Filters out repeating lines, most often used as uniq -c to get a count of unique results per entry. The uniq command filters out repeating lines by combining any repeated entries into a single result, to only show “unique” entries.

awk

A text processor for Unix –  typically used as a sorting mechanism by using awk -F (-F meaning “Field separator”).

head

Says to print the top 10 lines of the specified file(s). You can adjust the number of lines by adding the -n flag to the end, n meaning any number.

tail

Says to print the last 10 lines of the specified file(s). Similar to head, you can adjust the number of lines by adding the -n flag to the end, where n means any number. You can also use tail to live monitor access logs using tail -f logname.log.

find

Used to find files by a particular name, date, or extension type. You can use the flags -d to find directories, or -f to search files.

Apache access logs

So how do we put all the information above together? Let’s start by looking at the Apache access logs. Apache is the most commonly-used web server, so it’s a good place to start.

Before you get started, be sure to locate your access logs. Depending on the version of Linux you’re running, it could be in a slightly different location. On my server I’m using Ubuntu so my logs are found in the /var/log/apache2/ directory. Here’s an example of some of my Apache access logs for a reference point:

104.54.207.40 techgirlkb.guru - [18/Aug/2017:21:52:08 +0000] "GET /wp-content/uploads/2017/08/lynx_server_status_2.png HTTP/1.1" 200 223989 "http://techgirlkb.guru/2017/08/troubleshooting-high-server-load/" "Mozilla/5.0 (Macintosh; Intel Mac OS X 10_12_6) AppleWebKit/537.36 (KHTML, like Gecko) Chrome/59.0.3071.115 Safari/537.36"
104.54.207.40 techgirlkb.guru - [18/Aug/2017:21:52:08 +0000] "GET /wp-content/uploads/2017/08/sar-q-output-768x643.png HTTP/1.1" 200 357286 "http://techgirlkb.guru/2017/08/troubleshooting-high-server-load/" "Mozilla/5.0 (Macintosh; Intel Mac OS X 10_12_6) AppleWebKit/537.36 (KHTML, like Gecko) Chrome/59.0.3071.115 Safari/537.36"
104.54.207.40 techgirlkb.guru - [18/Aug/2017:21:52:08 +0000] "GET /wp-content/cache/autoptimize/js/autoptimize_a60c72b796d777751fdd13d6f0375f9c.js HTTP/1.1" 200 49995 "http://techgirlkb.guru/2017/08/troubleshooting-high-server-load/" "Mozilla/5.0 (Macintosh; Intel Mac OS X 10_12_6) AppleWebKit/537.36 (KHTML, like Gecko) Chrome/59.0.3071.115 Safari/537.36"
104.54.207.40 techgirlkb.guru - [18/Aug/2017:21:52:09 +0000] "GET /wp-content/uploads/2017/08/htop_mysql_usage.png HTTP/1.1" 200 456536 "http://techgirlkb.guru/2017/08/troubleshooting-high-server-load/" "Mozilla/5.0 (Macintosh; Intel Mac OS X 10_12_6) AppleWebKit/537.36 (KHTML, like Gecko) Chrome/59.0.3071.115 Safari/537.36"
104.54.207.40 techgirlkb.guru - [18/Aug/2017:21:52:09 +0000] "GET /wp-content/uploads/2017/08/mytop.jpg HTTP/1.1" 200 417613 "http://techgirlkb.guru/2017/08/troubleshooting-high-server-load/" "Mozilla/5.0 (Macintosh; Intel Mac OS X 10_12_6) AppleWebKit/537.36 (KHTML, like Gecko) Chrome/59.0.3071.115 Safari/537.36"

Totals of HTTP response codes

cut -d' ' -f9 techgirlkb.access.log | sort | uniq -c | sort -rn

This command says, using space (‘ ‘) as a delimiter, print the 9th field from techgirlkb.access.log. Then sort says to arrange the results lowest to highest, uniq -c says to combine all the same response codes into one entry and get a count, and then the sort -rn says to then sort your results from highest to lowest count. You should get an output like this:

1663 200
78 499
58 302
33 404
29 301
18 444
12 206
3 304
2 403
1 416

Hits to Apache per hour

awk -F'[' '{print $2 }' techgirlkb.access.log | awk -F: '{ print "Time: " $1,$2 ":00" }' | sort | uniq -c | more
This command says, using ‘[‘ as a delimiter, print the 2nd field from my Apache access log. Then with that output, using ‘:’ as a delimiter print the word “Time :” followed by the 1st and 2nd fields followed by “:00”. This allows you to group the requests in the hour together and get a count. You should get an output that looks like this:

293 Time: 18/Aug/2017 00:00
78 Time: 18/Aug/2017 01:00
188 Time: 18/Aug/2017 02:00
79 Time: 18/Aug/2017 03:00
27 Time: 18/Aug/2017 04:00
14 Time: 18/Aug/2017 05:00
40 Time: 18/Aug/2017 06:00
4 Time: 18/Aug/2017 07:00
74 Time: 18/Aug/2017 08:00

Top requests to Apache for today and yesterday

cat techgirlkb.access.log techgirlkb.access.log.1 | cut -d' ' -f7 | sort | uniq -c | sort -rn | head -20

This command says to concatenate today and yesterday’s access logs. Then, using space as the delimiter, print the 7th field. With that output, sort from lowest to highest, group like entries together, sort them by the count and then print the top 20 results. Your output should look something like this:

202 /wp-admin/admin-ajax.php
59 /feed/
49 /2017/08/troubleshooting-high-server-load/
37 /2017/08/the-anatomy-of-a-ddos/
33 /

Top IPs to hit the site today and yesterday

cat techgirlkb.access.log techgirlkb.access.log.1 | cut -d' ' -f1 | sort | uniq -c | sort -rn | head -25

This command says to concatenate the logs for today and yesterday. Then, with the output using space as a delimiter, print the 1st field. Sort and group your results together to get the list of the top 25 IPs. Here’s an example output:

343 104.54.207.40
341 104.196.38.166
114 66.162.212.19
75 38.140.212.19
56 173.212.242.97
46 5.9.106.230
45 173.212.203.245

Top User-Agents to hit the site today and yesterday

cat techgirlkb.access.log techgirlkb.access.log.1 | cut -d'"' -f6 | sort | uniq -c | sort -rn | head -20

This command says to concatenate today’s and yesterday’s logs. Then with the output, using double quotes (“) as the delimiter, print the 6th field. Sort and combine the results, printing the top 20 unique User-Agent strings.

628 Mozilla/5.0 (Macintosh; Intel Mac OS X 10_12_6) AppleWebKit/537.36 (KHTML, like Gecko) Chrome/59.0.3071.115 Safari/537.36
339 WordPress/4.8.1; http://techgirlkb.guru
230 Mozilla/5.0 (Macintosh; Intel Mac OS X 10_12_6) AppleWebKit/537.36 (KHTML, like Gecko) Chrome/60.0.3112.90 Safari/537.36
230 Mozilla/5.0 (compatible; MJ12bot/v1.4.7; http://mj12bot.com/)
209 Mozilla/5.0 (compatible; Googlebot/2.1; +http://www.google.com/bot.html)

Top HTTP referrers to the site today

cut -d'"' -f4 techgirlkb.access.log | sort | uniq -c | sort -rn | head -20

This command says to print the 4th field (using ” as the delimiter), sort and combine into unique entries and get a count, then print the top 20 results. Here’s what your output should look like:

714 -
278 http://techgirlkb.guru/2017/08/the-anatomy-of-a-ddos/
151 http://techgirlkb.guru/wp-admin/post-new.php
100 http://techgirlkb.guru/wp-admin/options-general.php?page=NextScripts_SNAP.php
87 http://techgirlkb.guru/wp-admin/

Nginx access logs

If you use Nginx access logs, you’ll need to adjust your commands to match the log format. Here’s what my Nginx logs look like, for an example to gather data:

18/Aug/2017:22:31:41 +0000|v1|104.196.38.166|techgirlkb.guru|499|0|127.0.0.1:6789|-|0.996|POST /wp-cron.php?doing_wp_cron=1503095500.1473810672760009765625 HTTP/1.1
18/Aug/2017:22:31:42 +0000|v1|104.54.207.40|techgirlkb.guru|302|4|127.0.0.1:6788|2.941|3.109|POST /wp-admin/post.php HTTP/1.1
18/Aug/2017:22:31:43 +0000|v1|104.54.207.40|techgirlkb.guru|200|60419|127.0.0.1:6788|0.870|0.870|GET /wp-admin/post.php?post=182&action=edit&message=10 HTTP/1.1
18/Aug/2017:22:31:44 +0000|v1|104.54.207.40|techgirlkb.guru|200|1321|-|-|0.000|GET /wp-content/plugins/autoptimize/classes/static/toolbar.css?ver=1503095503 HTTP/1.1
18/Aug/2017:22:31:44 +0000|v1|104.54.207.40|techgirlkb.guru|404|564|-|-|0.000|GET /wp-content/plugins/above-the-fold-optimization/admin/css/admincp-global.min.css?ver=2.7.12 HTTP/1.1

Notice that in these access logs, most fields are separated by a pipe (|). We also have some additional information in these logs, like how long the request took and what port it was routed to. We can use this information to look at even more contextual data. Usually your Nginx access logs can be found in /var/log/nginx/.

Totals of HTTP response codes today

cut -d'|' -f5 techgirlkb.access.log | sort | uniq -c | sort -rn
This command says to print the 5th field using pipe (|) as a delimiter. Then, sort and combine the results into unique entries by count, and show us the results sorted highest to lowest frequency. Your output should look something like this:

1751 200
113 499
59 302
34 404
29 301
18 444
12 206
3 304
2 403
1 416

Top requests to Nginx for today and yesterday

cut -d' ' -f3 techgirlkb.access.log | sort | uniq -c | sort -rn | head -20

This command says to use space as a delimiter, print the 3rd field. Then sort and combine the results, and print the top 20 results. Your output should look like this:

142 /wp-admin/admin-ajax.php
79 /wp-content/uploads/2017/08/staircase-600468_1280.jpg
54 /2017/08/the-anatomy-of-a-ddos/
53 /
41 /?url=https%3A//www.google-analytics.com/analytics.js&type=js&abtf-proxy=fd0703a0b1e757ef151b57e8dec02b32
32 /wp-includes/js/wp-emoji-release.min.js?ver=4.8.1
30 /robots.txt
30 /feed/

Show requests that took over 60 seconds to complete today

awk -F\| '{ if ($9 >= 60) print $0 }' techgirlkb.access.log
This command says, using pipe (|) as a delimiter, print the entire line only if the 9th field is greater than or equal to 60. The 9th field shows the response time in our Nginx logs. Your output should look something like this:

18/Aug/2017:00:30:45 +0000|v1|104.54.207.40|techgirlkb.guru|200|643|127.0.0.1:6788|63.400|67.321|POST /wp-admin/async-upload.php HTTP/1.1
18/Aug/2017:00:30:49 +0000|v1|104.54.207.40|techgirlkb.guru|200|644|127.0.0.1:6788|62.343|63.828|POST /wp-admin/async-upload.php HTTP/1.1
18/Aug/2017:00:30:56 +0000|v1|104.54.207.40|techgirlkb.guru|200|642|127.0.0.1:6788|61.613|64.402|POST /wp-admin/async-upload.php HTTP/1.1

Bash Tips and Tricks

When creating commands for searching your logs, there are a few best practices to keep in mind. We’ll cover some tips that apply to searching access logs below.

cat filename | grep pattern – never cat a single file and pipe to a grep. The cat command is made to concatenate the contents of multiple files. It’s much more efficient to use a format like: grep “pattern” filename

expr and seq – don’t use outdated scripting methods. Some examples would be expr and seq. For seq, counting is now built into bash, so it’s no longer needed. And expr is inefficient in that is written for outdated shell systems. In these older systems, expr starts a process that calls other programs to do the requested work. In general, it’s best practice to use newer and more efficient methods when making scripts.

ls -l | awk ‘{ print $8 }’ – If you’re searching for a filename within a directory, never parse the output of ls! The ls command is not consistent in its output across various platforms, meaning running it in one environment may offer far different results from another environment. And since some file names can contain a new line, this causes weird output in some cases as well.

For more best practices when writing scripts, check out this Bash FAQ.


Happy log crunching! I hope these tips and quick commands help you understand the output of your access logs, and help you build your own scripts to do the same. Have any other quick one-liners you use to search your logs? Let me know in the comments, or contact me.


The Anatomy of a DDoS

What does DDoS stand for?

First, let’s define the term “DDoS.” DDoS stands for “Distributed Denial of Service.” The concept behind a targeted DDoS attack is: overwhelm a server or site’s resources in order to bring it down. There can be many reasons behind a DDoS: personal vendettas, political disputes, disagreements, getting past security or firewall barriers, or even just for “fun.”

The effects of a DDoS attack can be truly devastating. Beyond server downtime, companies can suffer brand damage, bandwidth/usage overages, and more.

How do DDoS attacks happen?

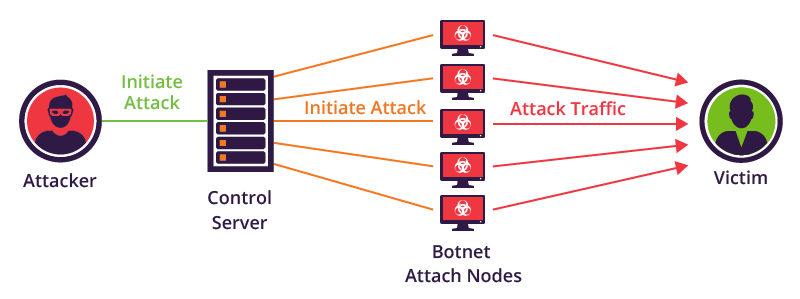
So how would one go about overwhelming a server’s resources? Most commonly this happens by attackers building a “botnet.” Botnets are typically a series of malware-infected machines connecting to the internet. Attackers will try to add devices like routers, computers, web servers and more to their botnet. A common method for this is to use “brute force” methods to hack into your site or device. Once a device is infected with malware, the attacker can direct the “army” of infected devices to send thousands of simultaneous requests to a site. As a result, one attacker can bring an entire site crumbling down.

a ddos
Source: Incapsula

The tricky part about the DDoS method is that the requests are coming from a wide range of IP addresses and user-agents. In this way, the attack is “distributed.” With this method the attack is coming from a vast network of devices. There is also a term “DoS” which just stands for “Denial of Service.” Plain “DoS” attacks originate from the same IP address. With this method, security systems are easily able to detect and block the attack. The system simply has to block the IP address to thwart the attack.

DDoS Mitigation

Once a DDoS is started, it’s pretty hard to mitigate the attack. Usually by the time an attack starts, the attacker knows the origin IP address where your site’s content resides. So by the time you get behind a service like CloudFlare or another Reverse Proxy service, it’s too late. While these services “hide” the origin IP address so attackers can’t see it. However, if they’ve found it already, the damage is done. In this case, you’ll need to get behind a DDoS protection service and then move your origin server and update DNS records.

Some common DDoS protection services include:

CloudFlare Business/Enterprise

Sucuri CloudProxy

Imperva Incapsula

Akamai Prolexic

The services above are great to use in preparation of an attack. If you’re already being attacked by a DDoS you would need to implement a service above and then change IP addresses. Or, you can use HiveShield from HiveWind, which can be deployed inside your current infrastructure. You can activate HiveShield even when your site is already being attacked. It will automatically begin deflecting the bad actors without needing to change Origin IPs. This is what sets HiveShield apart from its competitors.


If you want to try HiveShield DDoS protection on your own server, use the coupon code TCHGRLKB. This coupon code is good for 8 cores/$50 a month OR 16 cores/$100 a month, each with a free 30 day trial – a 50% savings!


Whichever service you use, be sure you use one to protect your site now! This way you’re protected against DDoS attacks. And, you won’t have to scramble to move your origin server if you’re attacked. So, which of these services is best? Read up, compare, and find which one is right for your business needs!

Have more questions about security? Is there a topic I didn’t cover? Feel free to let me know in the comments, or contact me.

  • Page 1
  • Page 2
  • Next Page »

Footer

Categories

  • Ansible
  • AWS
  • Git
  • Linux
  • Optimization
  • Performance
  • PHP
  • Scalability
  • Security
  • Uncategorized
  • WordPress

Copyright © 2025 · Atmosphere Pro on Genesis Framework · WordPress · Log in