• Skip to main content
  • Skip to footer

TechGirlKB

Performance | Scalability | WordPress | Linux | Insights

  • Home
  • Speaking
  • Posts
    • Linux
    • Performance
    • Optimization
    • WordPress
    • Security
    • Scalability
  • About Janna Hilferty
  • Contact Me

Linux

Troubleshooting High Server Load

Why does server load matter?

High server load is an issue that can affect any website. Some symptoms of high server load include: slow performance, site errors, and sometimes even site down responses. Troubleshooting high server load requires SSH access to the server where your site resides.

What is high server load?

First, you’ll want to find out: is my server’s load high? Server load is relative to the amount of CPU cores on said server. If your server has 4 cores, a load of “4” means you’re utilizing 100% available CPU. So first, you’ll want to find out how many cores your server has.

nproc – This command says to simply print the number of CPU cores. Quick and easy!

$ nproc
8

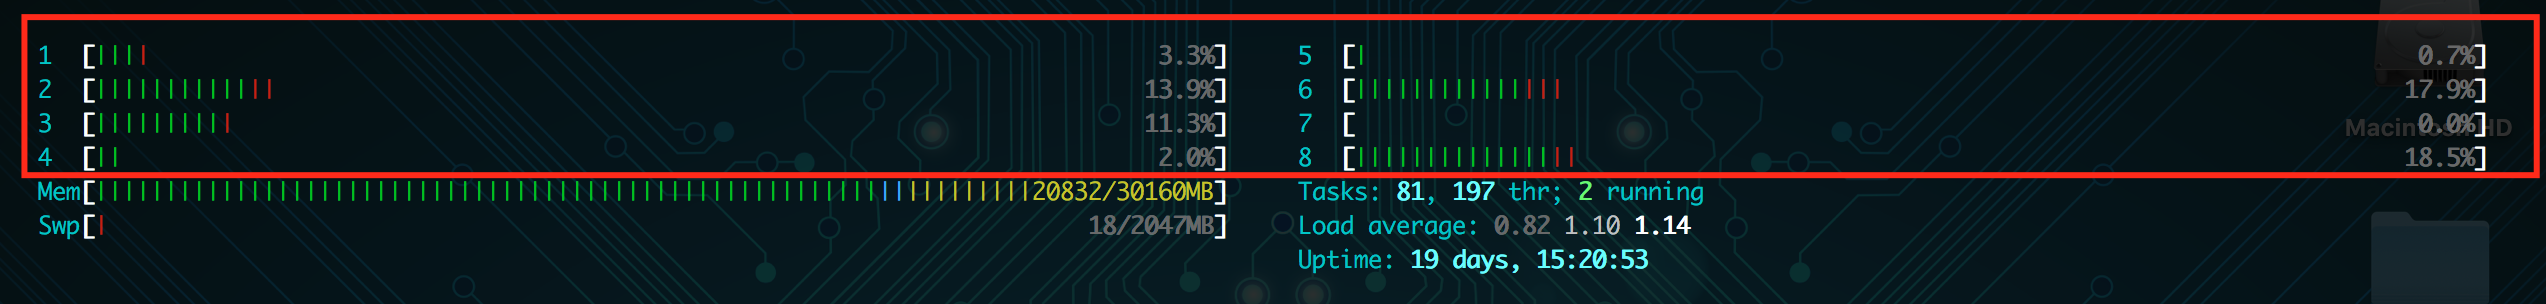
htop – This command will bring up a live monitor of your server’s resources and active processes. The htop command will show you a lot of information, including the number of cores on your server. The numbered rows are the CPU cores:

Now that we know how many CPU cores are on the server, we can find out: what is the load? There’s a few methods to find out:

uptime – This command will simply print what the current load is, the date and time, and how long the server has gone without rebooting. The numbers after “load average” indicates your server’s load average for the past minute, five minutes, and fifteen minutes respectively.

$ uptime
17:46:44 up 19 days, 15:25, 1 user, load average: 1.19, 1.01, 1.09

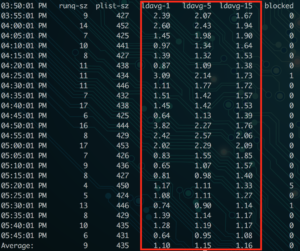
sar -q – This command will not only show you the current load for the last one, five, and fifteen minutes. It will show you the output of this command for every five minutes on the server since the beginning of the day.

htop – Just like finding the number of cores, htop will show you how many of the cores are being utilized (visually), and print the load average for the past one, five, and fifteen minutes.

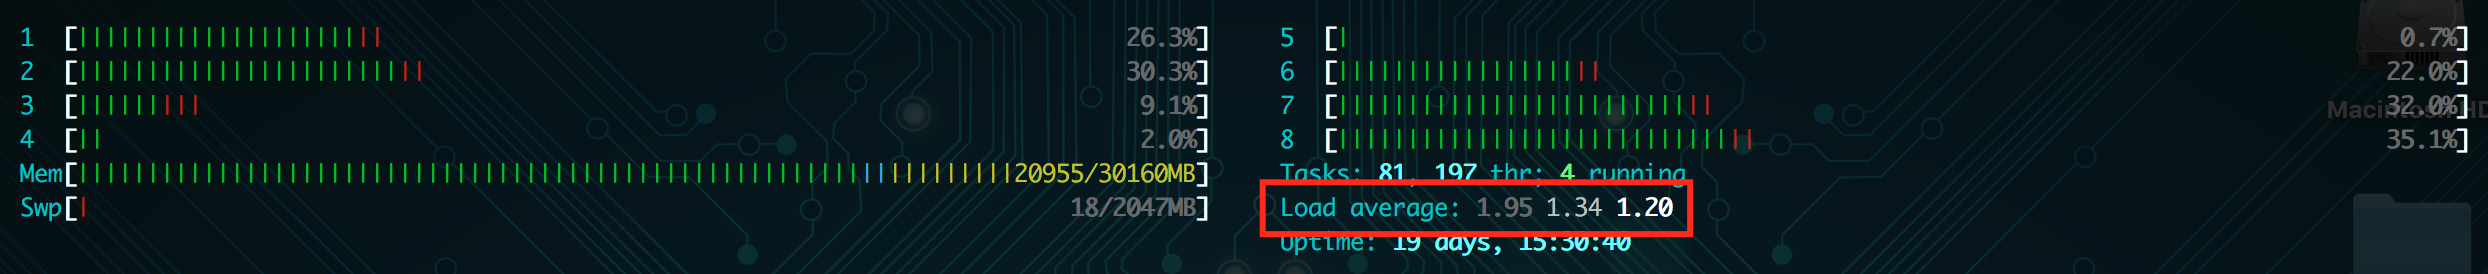
With just this information, I can see that the server example given does not have high server load. The load average has been between 1-2 today, and my server has 8 cores. So we’re seeing about a 25% max load on this server.

My server’s load is high! What now?

If you’ve used the above steps to identify high CPU load on your server, it’s time to find out why the load is high. The best place to start is again, htop. Look in the output below the number of cores and load average. This will show you the processes on your server, sorted by the percentage of CPU they’re using. Here’s an example:

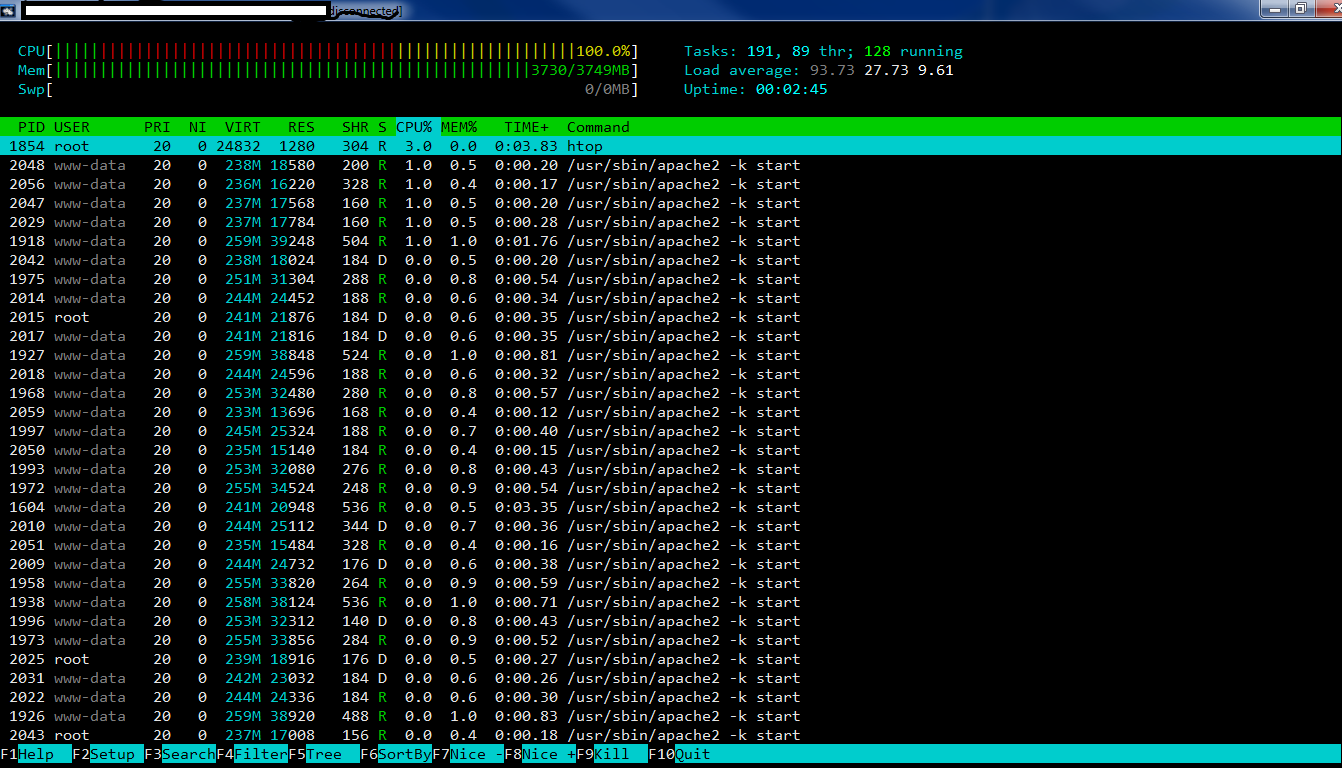
In this example we can see that there’s a long list of apache threads open! So much so, the server’s load is nearly 100. One of the key traits with Apache is knowing that each concurrent request on your website will open a new Apache thread, which uses more CPU and Memory. You can check out my blog post on Nginx vs Apache for more details on the architecture. In short, this means too many Apache threads are open at once.

So let’s see what’s currently running in Apache!

High load from Apache processes

lynx server-status – When using the Lynx you can see a plain text view of a webpage. This might not sound all that useful, but in the case of server load, there’s a module called mod_status that you can monitor with this. For a full breakdown, check out Tecmint’s overview of apache web server statistics.

lynx http://localhost:6789/server-status

If you’re checking this on your server, be sure to route the request to the port where Apache is running (in my case it’s 6789). Look at the output to see if there are any patterns – are there any of the same kind of request repeated? Is there a specific site or VHost making the most requests?

Once you’ve taken a look at what’s currently running, it’ll give you an idea of how to best search your access logs. Here’s some helpful access-log searching commands if you’re using the standard Apache-formatted logs:

Find the largest access log file for today (identify a site that’s hitting Apache hard):

ls -laSh /var/log/apache2/*.access.log | head -20 | awk '{ print $5,$(NF) }' | sed -e "s_/var/log/apache2/__" -e "s_.access.log__" | column -t

(be sure to change out the path for the real path to your access logs – check out the list of access log locations for more help finding your logs).

Find the top requests to Apache on a specific site (change out the log path with the info from the link above if needed):

cut -d' ' -f7 /var/log/apache2/SITENAME.access.log | sort | uniq -c | sort -rn | head -20

Find the top user-agents hitting your site:

cut -d'"' -f6 /var/log/apache2/SITENAME.apachestyle.log | sort | uniq -c | sort -rn | head -20

Find the top IP addresses hitting your site:

cut -d' ' -f1 /var/log/apache2/SITENAME.apachestyle.log | sort | uniq -c | sort -rn | head -25 | column -t

High load from MySQL

The other most common offender for high load and high Memory usage is MySQL. If sites on your server are running a large number of queries to MySQL at the same time, it could cause high Memory usage on the server. If MySQL uses more Memory than it’s allotted, it will begin to write to swap, which is an I/O process. Eventually, servers will begin to throttle the I/O processes, causing the processes waiting on those queries to stall. This adds even more CPU load, until the server load is destructively high and the server needs to be rebooted. Check out the InnoDB vs MyISAM section of my blog post for more information on this.

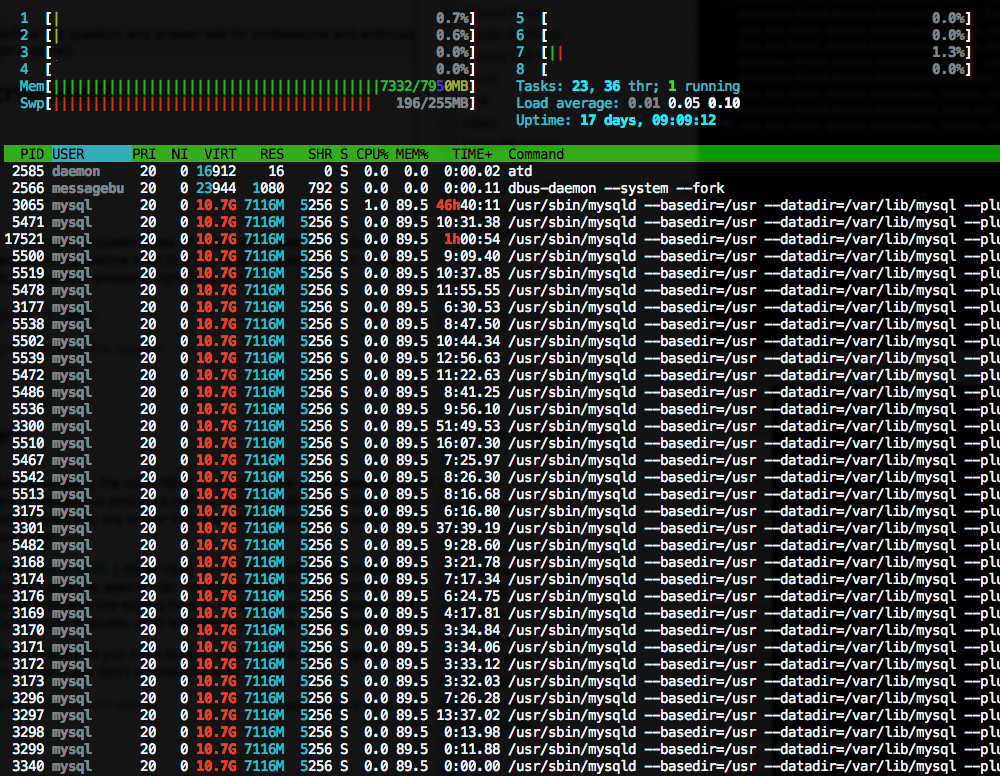
In the above example, you can see the Memory being over utilized by MySQL – the bottom left column at the top indicates swap usage. The server is using so much swap it’s almost maxed out! If you’re running htop and notice the highest user of CPU is a mysql process, it’s time to bring out mytop to monitor the active queries being run.

mytop – This is an active query monitor tool. Often times you’ll need to run this command with sudo, for reference. Check out Digital Ocean’s documentation to get mytop up and running.

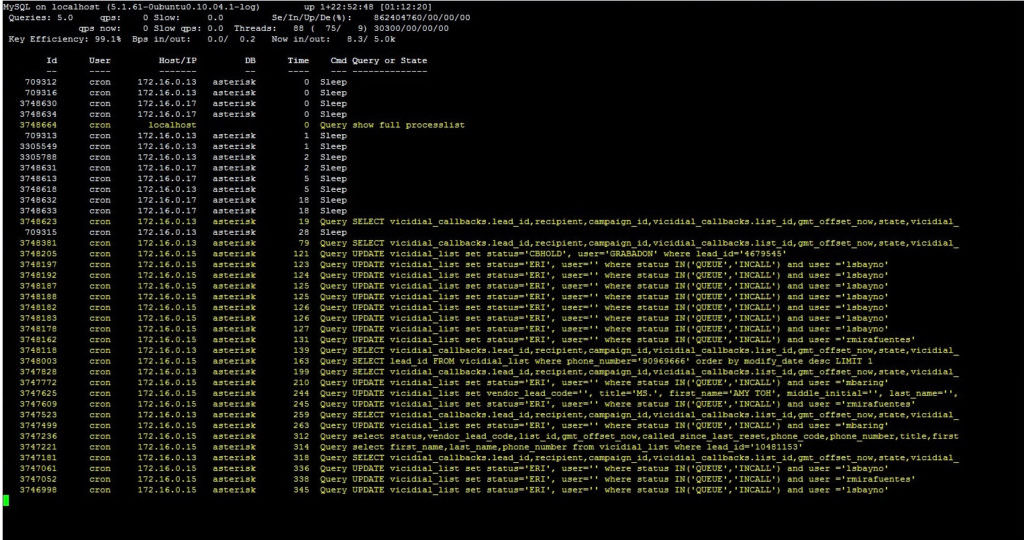
This can help you track down what queries are slow, and where they’re coming from. Maybe it’s a plugin or theme on your site, or a daily cron job. In the example above, crons were responsible for the long queries to the “asterisk” database.

Other causes of high load

On top of Apache and MySQL, there’s definitely other causes of poor performance. Always start with htop to identify the bad actors causing high load. It might be server-level crons running, sleep-state processes waiting too long to complete, writing to logs, or any number of things. From there you can narrow your search until you’ve identified the cause, so you can work towards a solution!

While there can be many causes of high server load, I hope this article has been helpful to identify a few key ways to troubleshoot the top offenders. Have any input or other advice when troubleshooting high server load? Let me know in the comments, or contact me.


4 Important Ways to Identify a Botnet

What is a botnet?

A botnet is a series of internet devices (computers, websites, servers, modems, mobile phones, and more) infected with malware, harnessed together. Their purpose is to infect more devices with malware to build their network even further.

Botnets are sometimes very hard to identify because of their nature to switch IP addresses frequently, so as to not trigger security software to take action. Furthermore, botnets can “spoof” legitimate browsers in their requests, making it seem like the request is coming from a normal web browser or mobile phone.

These attributes aside, there are still a few key tricks you can use to identify a botnet.

Bots don’t load assets

Try visiting your site, then look through your site’s access logs. Locate the requests associated with your IP address. Do you see a “GET /” entry in the log? You should! But you should also see a number of static files requested after that, like requests for your theme’s CSS and JavaScript files.

One key attribute of botnets is that they do not load these CSS and JavaScript files. For these you will ONLY see a “GET /” entry, but no static files requested. What’s tricky about this is because botnets don’t load Javascript, these visits to your site are invisible on your Google Analytics reports. You’ll need access to logs from your site’s server itself to identify a botnet.

Bots make illegitimate POST requests

Another way to identify a botnet is to look at the behavior of the IP address: they will often try to make “POST” requests instead of just “GET” requests. A POST request is a request intended to update information, or login to a site. In WordPress, the most common places for this would be your /wp-login.php page, and your /xmlrpc.php page.

The /wp-login.php page is where you and your site authors will log into your WordPress site. A POST request here comes from someone trying to log into the site. On WP Engine, POST requests to the login page without loading the page’s assets are blocked, meaning you are safe from being infected by malware. But, these botnets may be bothersome all the same for various reasons.

Similarly, the /xmlrpc.php page is another page targeted by botnets. This page only accepts POST requests from mobile posting apps, so that you can remotely update your site. Botnets will target these pages in hopes of some kind of security exploit, so they can infect your site and server with malware. On WP Engine, requests to XMLRPC are only accepted from legitimate users on your site, which is another way they protect you from this kind of traffic.

Bots may spoof “fake” browser versions

In your site’s access logs, you’ll generally see entries like this:

172.56.7.237 techgirlkb.guru - [07/Aug/2017:02:32:11 +0000] "GET /2017/08/quick-wins-database-optimization/ HTTP/1.1" 200 9064 "http://m.facebook.com/" "Mozilla/5.0 (Linux; Android 7.1.2; Pixel XL Build/NKG47M; wv) AppleWebKit/537.36 (KHTML, like Gecko) Version/4.0 Chrome/59.0.3071.125 Mobile Safari/537.36 [FB_IAB/FB4A;FBAV/135.0.0.22.90;]; WPEPF/1"

This section in quotes “Mozilla/5.0 (Linux; Android 7.1.2; Pixel XL Build/NKG47M; wv) AppleWebKit/537.36 (KHTML, like Gecko) Version/4.0 Chrome/59.0.3071.125 Mobile Safari/537.36 [FB_IAB/FB4A;FBAV/135.0.0.22.90;]; WPEPF/1” is the “user agent string” for the request that came in. Normally with a long string like this, it looks like a pretty legitimate user. But often times, botnets will use a user agent string that looks legitimate, but is just slightly off. Here’s an example of one I see a lot:

"Mozilla/5.0 (Windows NT 6.1; WOW64; rv:40.0) Gecko/20100101 Firefox/40.1"

This one is really tricky. Based on the results of my user agent string lookup, it appears to be a Windows 7 user, using Firefox version 40.1 as a web browser. Only, Firefox doesn’t have a version 40.1. You can find the real versions of Firefox on their website. This is another way in which it can be hard to identify a botnet: they evade normal security software and firewalls by pretending to be legitimate user agents.

Botnets will change IPs after an invalid response

Last, the other key behavioral trait of a botnet is that it will rotate IP addresses. Usually this happens when the botnet detects it’s been blocked. For instance, if it receives an empty response or a 403 Forbidden response, this signals the botnet that it’s time to move on to a different IP address from another one of its malware-infected devices in the network.

There are several known Internet Service Providers and cell carriers whose devices are most vulnerable to this kind of botnet and to malware. You can read more about it in this comprehensive study done by WordFence. You’ll notice if you do an IP lookup for the IP addresses making these requests, that most are from obscure countries, with the same telecom provider.

One way you can battle the rotating IP addresses is by limiting the traffic allowed to your site to only countries you know to be legitimate. Or (if that’s going to be a really long list), you can alternatively block traffic from the countries you see these botnet requests originating from.

What are IOPS and Why are They Important?

In every engineer’s life, there comes a time when your company decides it’s time to choose a new web host. This process can go smoothly, or you could crash and burn. The difference in the outcomes often comes down to: IOPS.

What are IOPS?

So what are IOPS? IOPS stands for Input/Output operations per second. This is an allowed value pre-determined by your webhost, which controls how many Input/Output operations are allowed at once on your server. After the threshold is reached, the host may begin throttling these operations, causing requests and processes to queue up. This in turn causes sleep-state processes, which inflates your server load more and more, until the backlog queue of requests finally completes. The processes left waiting in this time are affected by “IOWait.”

So why are IOPS important?

With that in mind, it’s first important to understand how many IOPS your site really needs. Start by getting some stats from your current environment. How long does it take your current server to process requests? How many CPU cores and how much Memory is allocated on your current environment? At your daily peak for CPU load, how many active processes were running and how fast were they? What is the ratio of disk reads to disk writes?

What IOPS benchmarks are important?

Second, don’t take the IOPS metrics different companies boast about too seriously. IOPS can vary drastically depending on the type of operation, size of the server block, number of requests, and weight of those requests. It would be easy for a vendor to falsely inflate the IOPS their systems can handle by showing a dedicated block with lightweight reads and writes. It’s important to ask about how the benchmarks were made. What was the read/write ratio? Were there other tenants on the disk? Is there a set point at which requests are throttled?

Getting specific

It might be more appropriate to develop a test instance of one of your heavier-trafficked sites on a new web host, and perform load testing to see how the type of traffic your site normally experiences performs on the new environment. The more specific to your own needs the testing can be, the better. Be sure to check with the vendor on their policies for load testing before getting started.

Linux and Page Faults

What are Page Faults?

If you’ve ever been monitoring a Linux process you might notice an odd metric: Page Faults. On the surface Page faults can sound scary. But in reality, a page fault is the natural process of requesting physical Memory to be allocated to different processes.

Linux divides up its physical Memory into “pages,” which are then mapped to virtual memory for individual processes. Each “page” equates to about 4kb of physical memory. And, just because the pages are mapped to a certain process, this doesn’t necessarily mean the process is actively using those pages. There can be both inactive and active pages in use by a process on the server.

So what is a page fault? Don’t worry, it doesn’t really have anything to do with errors. A page fault simply happens when a program is executing some code, and the executable code for that program isn’t currently being actively held in physical pages of Memory. Linux responds by allocating more pages to that program so that it can complete its execution of the code.

Minor Page Faults vs Major Page Faults

You may also see a shockingly high number of “minor page faults” in monitoring your process. Minor page faults are even less worrisome than major ones. This simply means a process requested data that’s already stored in Memory. The Memory just wasn’t allocated to the process requesting it. Linux will remap the currently used data to be shared between the two processes, without having to access the physical memory. The easiest way to remember the difference is: minor page faults can be served from existing virtual memory, while major page faults have to request more pages be allocated from the physical memory.

Page Faults and Swap

So what happens if your server has already mapped all its pages of the physical memory to different processes, but more Memory is needed to perform a task? The system will begin “writing to swap.” This is not a great scenario in any situation. The system will write some of the pages it’s holding onto in Memory to the disk. This frees some pages to satisfy incoming page fault requests.

Compared to using virtual Memory, writing pages to disk is super slow. And, writing to disk is an IO operation which can be throttled on many hosts if it happens too much. In regards to page faults, the process of using swap is the most worrisome. Using swap can easily become a downward spiral! Pages requested are written to disk, which overwrites other pages requested previously. But when the previous pages are requested again the cycle repeats itself again and again, until your system crashes.

With that in mind, the important aspects of your system to monitor are not necessarily the major or minor page faults, but rather the amount of swap being used.


Have you experienced issues with swap usage or page faults on your own system? Tell me about it in the comments.

  • « Previous Page
  • Page 1
  • Page 2

Footer

Categories

  • Ansible
  • AWS
  • Git
  • Linux
  • Optimization
  • Performance
  • PHP
  • Scalability
  • Security
  • Uncategorized
  • WordPress

Copyright © 2025 · Atmosphere Pro on Genesis Framework · WordPress · Log in