• Skip to main content
  • Skip to footer

TechGirlKB

Performance | Scalability | WordPress | Linux | Insights

  • Home
  • Speaking
  • Posts
    • Linux
    • Performance
    • Optimization
    • WordPress
    • Security
    • Scalability
  • About Janna Hilferty
  • Contact Me

Posts

Protecting Your Site From Content Injection

What is Content Injection?

Content Injection, otherwise known as Content Spoofing, is the act of manipulating what a user sees on a site by adding parameters to their URL. This act is a known form of attack on a website. While Content Injection and XSS (Cross Site Scripting) Attacks are similar, they differ in a few key ways. Firstly, XSS attacks specifically target users by using <script> parameters, mainly using JavaScript. Content Injection by comparison mainly relies on adding parameters to the end of a static URL (/login.php for example).

Here’s a basic example:

content injection

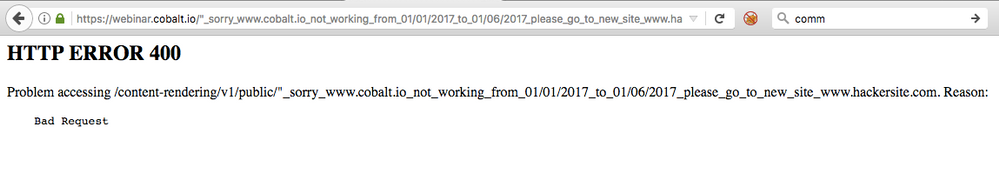
For static files like error pages (in this case a 400 error), attackers can manipulate the text on the page to say what they want. You’ll see in the URL bar that the attacker added extra text to the URL which made the error page print the text since it was part of the URL. Notice, they couldn’t make “www.hackersite.com” actually a clickable link in the basic output which is a good sign. But, easily misled visitors may still try to navigate to “www.hackersite.com” based on the text on this page. The general intent of content injection is usually phishing. Or in other words, getting users to enter their sensitive information by misleading them.

So what’s the fix?

In the interest of protecting your site from content injection on static files like the above, you’d want to use the “AllowEncodedSlashes” directive in Apache like so:

AllowEncodedSlashes NoDecode

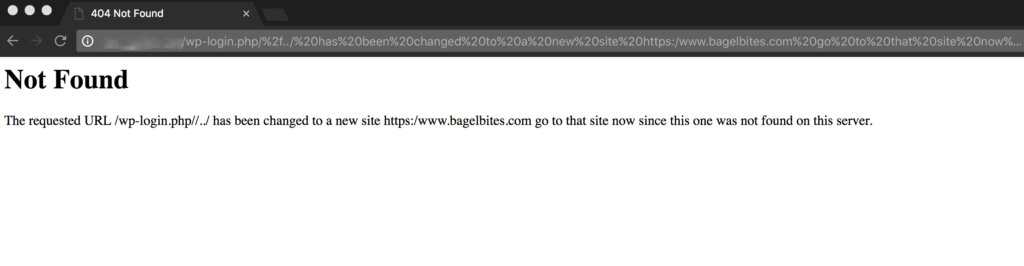
With this directive you’re telling Apache to not necessarily show a 404 when “encoded slashes” like %2F and %5C in the URL are added, but instead to show the actual page that *should* have come up. Here’s an example from one of my own sites, with and without encoded slashes set to NoDecode:

content injection

And with the NoDecode directive set:

content injection

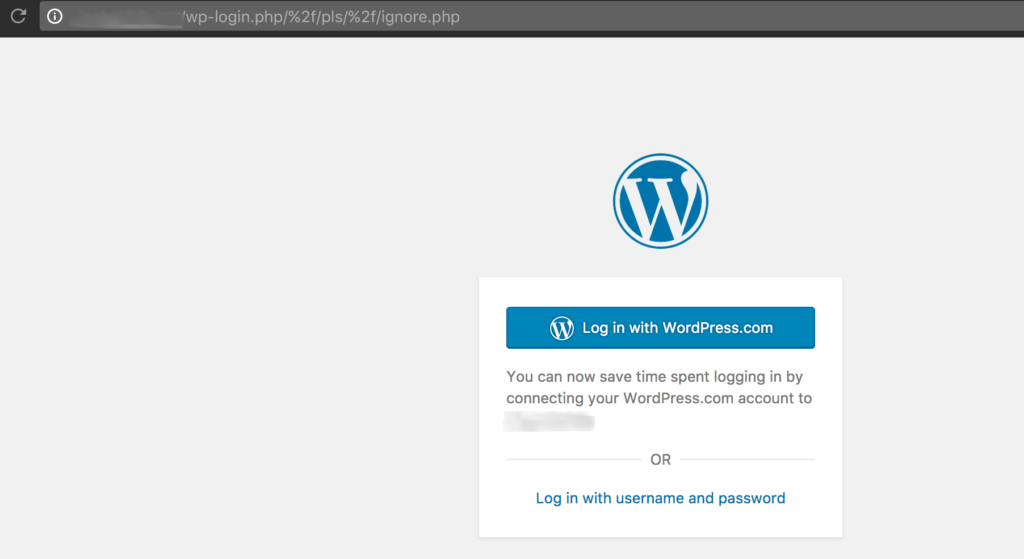
So, using the NoDecode option I’m able to let my users see the correct page, even if someone tried to manipulate the URL to print other text.

Another alternative would be to rewrite static files to your WordPress theme’s 404 page. This way users see your custom page instead of the default white-text static error pages (since they can be manipulated as we saw). This isn’t always the best option for all sites though. It all depends on how you want to handle requests with extra content added to the end.

These types of content injection are usually pretty low-risk. This is because all the attacker can do is manipulate text on specific files. If your site is being affected by XSS though, to where they are able to inject URL links and formatting on a page, that is a more serious concern. Use this guide to help prevent XSS on your site.


That’s all, folks! Have more input on content injection? More tips or tricks? Want to hear more? Let me know in the comments or contact me.


Understanding Segmentation Faults in Linux

Defining Segmentation Faults

First, let’s look at the Wikipedia definition for Segmentation faults:

“A segmentation fault occurs when a program attempts to access a memory location that it is not allowed to access, or attempts to access a memory location in a way that is not allowed (for example, attempting to write to a read-only location, or to overwrite part of the operating system).”

That may sound like a bunch of jargon, so if you’re just as confused as before I don’t blame you. The truth is, Segmentation faults are one of the most confusing topics to understand, much less troubleshoot.

Here’s how I understand Segmentation faults:

  • A request/process reached into some Memory on your server that wasn’t allocated to it
  • Or, a process tried to access Memory in a way that was not allowed

Most often I see Segmentation faults in situations of a Memory leak, or something conflicting with your platform’s rules. The rules could include allowing reads/writes to specific ports, specific conditions of accessing those ports, or security rules blocking one part of the filesystem from reaching into another.

Are Segmentation Faults Happening?

So now that we’ve defined Segmentation faults, how do you know if they’re happening? Usually you’ll see it in your server’s error.log file. For example, here’s an Apache error log with Segmentation faults:

segmentation faults

Segmentation faults could potentially happen with any program, not necessarily just Apache. For web servers that use Apache or a combination of Nginx and Apache though, this will be the most common place to look. If another application is running into errors, that service’s error.log file will be the place to look.

Diagnosing Segmentation Faults

Unfortunately, most servers don’t offer a great way to see what’s happening with your Memory. As a result Segmentation faults can be extremely difficult to pin down. If you’re lucky enough to use both Apache and Nginx, most likely you’re using Nginx as a proxy server. In this case, your Nginx error logs will offer a little more information:

segmentation faults

If you’re using a proxy server, you’ll see “upstream connection” errors. This is because Nginx has passed the request to Apache to be served, but the Segmentation fault caused the request to be killed. Nginx is still waiting for the response, so when it’s killed it receives the upstream error. Luckily Nginx logs a little more about the request itself, to offer some more context:

  • The date and time
  • IP of the client that made the request
  • URL of the request
  • Port it was routed to
  • HTTP Referrer

All of this contextual information can help you narrow down the issue. For example, if I see that the port these requests were routed to only accepts read requests and I see a request that’s likely doing a write request, that explains my issue. I’d need to be sure to route the request to a read/write port instead. Or, if I see that the requests are all from a specific IP address or a specific page, I can dig into the elements that are specific to it to diagnose the issue.

If you don’t have these logs to guide you, you’ll probably need to use either a strace or a core dump. Both of these can be pretty nebulous to read, so tread with caution.

strace

Use a strace when you can reliably replicate the issue. This method traces all the calls and system files being made by the request. It’s best to store the output in a file, so you’d probably want to use a method like this:

sudo strace -p 17389 -o segfault_trace.txt

In the above example, the -p is to trace a specific process ID (or PID for short). You can find this by running the following:

$ ps -C apache2
PID TTY TIME CMD
8225 ? 00:00:01 apache2
8292 ? 00:00:00 apache2
17389 ? 00:07:21 apache2
27732 ? 00:00:06 apache2

And the -o flag in the example says to store the output to the “segfault_trace.txt” file. Storing it to a file makes it easier to search through the text output for any errors or indicators.

core dumps

Using a core dump can also help diagnose a segmentation fault. In this method you first need to have “core dumps” enabled on your server. From there when Segmentation faults are triggered, the core dump will include information about where the Memory was allocated and what issue with the Memory occurred. Check out this overview of how to read the core file that was dumped for more help.


There you have it – some helpful ways to diagnose a Segmentation fault issue. Have more questions about Segmentation faults? Are there other scenarios where you’ve run into Segmentation faults? Let me know in the comments, or contact me.


Deciphering Your Site’s Access Logs

Requirements

Searching your site’s access logs can be difficult! There’s a lot of information to visually take in, which means viewing the entire log entry can sometimes be overwhelming. In this article we’ll discuss ways to parse your access logs to better understand trends on your site!

Before we get started, let’s talk prerequisites. In order to use the bash commands we’ll discuss, you’ll need:

  • Apache and/or Nginx
  • SSH access to your server

Using grep, cut, sort, uniq, and awk

Before we dive into the logs themselves, let’s talk about how we’ll be parsing them. First, you’ll want to understand the bash commands we use to collect specific pieces of information from the logs.

cat

Used to “concatenate” two or more files together. In the case of searching access logs, we’d typically use it to print out results from two files together, to search for information in both. For example, if I wanted to print or search both today’s and yesterday’s logs.

zcat

Works the same as cat, but concatenates and prints out results of gzip (.gz) compressed files specifically.

grep

Use to search for a specific string or quote in a single file.

ack-grep

Used to find strings in a file or several files. The ack-grep command is more efficient than grep when looking for results in a directory or multiple files. And, unlike a standard grep, ack-grep prints out the specific line in which the text string was found. It’s also easier to only search in files of a specific kind, like PHP files for example.

cut

Used to cut out specific pieces of information, useful for sorting through grep results. Using the -d flag you can set a “delimiter” (dividing signal). And using the -f flag you can choose which field(s) separated by said delimiter to print out specifically.

sort

Sorts output results from lowest to highest, useful for sorting grep and cut results. You can use sort -rn to show results from highest to lowest instead.

uniq

Filters out repeating lines, most often used as uniq -c to get a count of unique results per entry. The uniq command filters out repeating lines by combining any repeated entries into a single result, to only show “unique” entries.

awk

A text processor for Unix –  typically used as a sorting mechanism by using awk -F (-F meaning “Field separator”).

head

Says to print the top 10 lines of the specified file(s). You can adjust the number of lines by adding the -n flag to the end, n meaning any number.

tail

Says to print the last 10 lines of the specified file(s). Similar to head, you can adjust the number of lines by adding the -n flag to the end, where n means any number. You can also use tail to live monitor access logs using tail -f logname.log.

find

Used to find files by a particular name, date, or extension type. You can use the flags -d to find directories, or -f to search files.

Apache access logs

So how do we put all the information above together? Let’s start by looking at the Apache access logs. Apache is the most commonly-used web server, so it’s a good place to start.

Before you get started, be sure to locate your access logs. Depending on the version of Linux you’re running, it could be in a slightly different location. On my server I’m using Ubuntu so my logs are found in the /var/log/apache2/ directory. Here’s an example of some of my Apache access logs for a reference point:

104.54.207.40 techgirlkb.guru - [18/Aug/2017:21:52:08 +0000] "GET /wp-content/uploads/2017/08/lynx_server_status_2.png HTTP/1.1" 200 223989 "http://techgirlkb.guru/2017/08/troubleshooting-high-server-load/" "Mozilla/5.0 (Macintosh; Intel Mac OS X 10_12_6) AppleWebKit/537.36 (KHTML, like Gecko) Chrome/59.0.3071.115 Safari/537.36"
104.54.207.40 techgirlkb.guru - [18/Aug/2017:21:52:08 +0000] "GET /wp-content/uploads/2017/08/sar-q-output-768x643.png HTTP/1.1" 200 357286 "http://techgirlkb.guru/2017/08/troubleshooting-high-server-load/" "Mozilla/5.0 (Macintosh; Intel Mac OS X 10_12_6) AppleWebKit/537.36 (KHTML, like Gecko) Chrome/59.0.3071.115 Safari/537.36"
104.54.207.40 techgirlkb.guru - [18/Aug/2017:21:52:08 +0000] "GET /wp-content/cache/autoptimize/js/autoptimize_a60c72b796d777751fdd13d6f0375f9c.js HTTP/1.1" 200 49995 "http://techgirlkb.guru/2017/08/troubleshooting-high-server-load/" "Mozilla/5.0 (Macintosh; Intel Mac OS X 10_12_6) AppleWebKit/537.36 (KHTML, like Gecko) Chrome/59.0.3071.115 Safari/537.36"
104.54.207.40 techgirlkb.guru - [18/Aug/2017:21:52:09 +0000] "GET /wp-content/uploads/2017/08/htop_mysql_usage.png HTTP/1.1" 200 456536 "http://techgirlkb.guru/2017/08/troubleshooting-high-server-load/" "Mozilla/5.0 (Macintosh; Intel Mac OS X 10_12_6) AppleWebKit/537.36 (KHTML, like Gecko) Chrome/59.0.3071.115 Safari/537.36"
104.54.207.40 techgirlkb.guru - [18/Aug/2017:21:52:09 +0000] "GET /wp-content/uploads/2017/08/mytop.jpg HTTP/1.1" 200 417613 "http://techgirlkb.guru/2017/08/troubleshooting-high-server-load/" "Mozilla/5.0 (Macintosh; Intel Mac OS X 10_12_6) AppleWebKit/537.36 (KHTML, like Gecko) Chrome/59.0.3071.115 Safari/537.36"

Totals of HTTP response codes

cut -d' ' -f9 techgirlkb.access.log | sort | uniq -c | sort -rn

This command says, using space (‘ ‘) as a delimiter, print the 9th field from techgirlkb.access.log. Then sort says to arrange the results lowest to highest, uniq -c says to combine all the same response codes into one entry and get a count, and then the sort -rn says to then sort your results from highest to lowest count. You should get an output like this:

1663 200
78 499
58 302
33 404
29 301
18 444
12 206
3 304
2 403
1 416

Hits to Apache per hour

awk -F'[' '{print $2 }' techgirlkb.access.log | awk -F: '{ print "Time: " $1,$2 ":00" }' | sort | uniq -c | more
This command says, using ‘[‘ as a delimiter, print the 2nd field from my Apache access log. Then with that output, using ‘:’ as a delimiter print the word “Time :” followed by the 1st and 2nd fields followed by “:00”. This allows you to group the requests in the hour together and get a count. You should get an output that looks like this:

293 Time: 18/Aug/2017 00:00
78 Time: 18/Aug/2017 01:00
188 Time: 18/Aug/2017 02:00
79 Time: 18/Aug/2017 03:00
27 Time: 18/Aug/2017 04:00
14 Time: 18/Aug/2017 05:00
40 Time: 18/Aug/2017 06:00
4 Time: 18/Aug/2017 07:00
74 Time: 18/Aug/2017 08:00

Top requests to Apache for today and yesterday

cat techgirlkb.access.log techgirlkb.access.log.1 | cut -d' ' -f7 | sort | uniq -c | sort -rn | head -20

This command says to concatenate today and yesterday’s access logs. Then, using space as the delimiter, print the 7th field. With that output, sort from lowest to highest, group like entries together, sort them by the count and then print the top 20 results. Your output should look something like this:

202 /wp-admin/admin-ajax.php
59 /feed/
49 /2017/08/troubleshooting-high-server-load/
37 /2017/08/the-anatomy-of-a-ddos/
33 /

Top IPs to hit the site today and yesterday

cat techgirlkb.access.log techgirlkb.access.log.1 | cut -d' ' -f1 | sort | uniq -c | sort -rn | head -25

This command says to concatenate the logs for today and yesterday. Then, with the output using space as a delimiter, print the 1st field. Sort and group your results together to get the list of the top 25 IPs. Here’s an example output:

343 104.54.207.40
341 104.196.38.166
114 66.162.212.19
75 38.140.212.19
56 173.212.242.97
46 5.9.106.230
45 173.212.203.245

Top User-Agents to hit the site today and yesterday

cat techgirlkb.access.log techgirlkb.access.log.1 | cut -d'"' -f6 | sort | uniq -c | sort -rn | head -20

This command says to concatenate today’s and yesterday’s logs. Then with the output, using double quotes (“) as the delimiter, print the 6th field. Sort and combine the results, printing the top 20 unique User-Agent strings.

628 Mozilla/5.0 (Macintosh; Intel Mac OS X 10_12_6) AppleWebKit/537.36 (KHTML, like Gecko) Chrome/59.0.3071.115 Safari/537.36
339 WordPress/4.8.1; http://techgirlkb.guru
230 Mozilla/5.0 (Macintosh; Intel Mac OS X 10_12_6) AppleWebKit/537.36 (KHTML, like Gecko) Chrome/60.0.3112.90 Safari/537.36
230 Mozilla/5.0 (compatible; MJ12bot/v1.4.7; http://mj12bot.com/)
209 Mozilla/5.0 (compatible; Googlebot/2.1; +http://www.google.com/bot.html)

Top HTTP referrers to the site today

cut -d'"' -f4 techgirlkb.access.log | sort | uniq -c | sort -rn | head -20

This command says to print the 4th field (using ” as the delimiter), sort and combine into unique entries and get a count, then print the top 20 results. Here’s what your output should look like:

714 -
278 http://techgirlkb.guru/2017/08/the-anatomy-of-a-ddos/
151 http://techgirlkb.guru/wp-admin/post-new.php
100 http://techgirlkb.guru/wp-admin/options-general.php?page=NextScripts_SNAP.php
87 http://techgirlkb.guru/wp-admin/

Nginx access logs

If you use Nginx access logs, you’ll need to adjust your commands to match the log format. Here’s what my Nginx logs look like, for an example to gather data:

18/Aug/2017:22:31:41 +0000|v1|104.196.38.166|techgirlkb.guru|499|0|127.0.0.1:6789|-|0.996|POST /wp-cron.php?doing_wp_cron=1503095500.1473810672760009765625 HTTP/1.1
18/Aug/2017:22:31:42 +0000|v1|104.54.207.40|techgirlkb.guru|302|4|127.0.0.1:6788|2.941|3.109|POST /wp-admin/post.php HTTP/1.1
18/Aug/2017:22:31:43 +0000|v1|104.54.207.40|techgirlkb.guru|200|60419|127.0.0.1:6788|0.870|0.870|GET /wp-admin/post.php?post=182&action=edit&message=10 HTTP/1.1
18/Aug/2017:22:31:44 +0000|v1|104.54.207.40|techgirlkb.guru|200|1321|-|-|0.000|GET /wp-content/plugins/autoptimize/classes/static/toolbar.css?ver=1503095503 HTTP/1.1
18/Aug/2017:22:31:44 +0000|v1|104.54.207.40|techgirlkb.guru|404|564|-|-|0.000|GET /wp-content/plugins/above-the-fold-optimization/admin/css/admincp-global.min.css?ver=2.7.12 HTTP/1.1

Notice that in these access logs, most fields are separated by a pipe (|). We also have some additional information in these logs, like how long the request took and what port it was routed to. We can use this information to look at even more contextual data. Usually your Nginx access logs can be found in /var/log/nginx/.

Totals of HTTP response codes today

cut -d'|' -f5 techgirlkb.access.log | sort | uniq -c | sort -rn
This command says to print the 5th field using pipe (|) as a delimiter. Then, sort and combine the results into unique entries by count, and show us the results sorted highest to lowest frequency. Your output should look something like this:

1751 200
113 499
59 302
34 404
29 301
18 444
12 206
3 304
2 403
1 416

Top requests to Nginx for today and yesterday

cut -d' ' -f3 techgirlkb.access.log | sort | uniq -c | sort -rn | head -20

This command says to use space as a delimiter, print the 3rd field. Then sort and combine the results, and print the top 20 results. Your output should look like this:

142 /wp-admin/admin-ajax.php
79 /wp-content/uploads/2017/08/staircase-600468_1280.jpg
54 /2017/08/the-anatomy-of-a-ddos/
53 /
41 /?url=https%3A//www.google-analytics.com/analytics.js&type=js&abtf-proxy=fd0703a0b1e757ef151b57e8dec02b32
32 /wp-includes/js/wp-emoji-release.min.js?ver=4.8.1
30 /robots.txt
30 /feed/

Show requests that took over 60 seconds to complete today

awk -F\| '{ if ($9 >= 60) print $0 }' techgirlkb.access.log
This command says, using pipe (|) as a delimiter, print the entire line only if the 9th field is greater than or equal to 60. The 9th field shows the response time in our Nginx logs. Your output should look something like this:

18/Aug/2017:00:30:45 +0000|v1|104.54.207.40|techgirlkb.guru|200|643|127.0.0.1:6788|63.400|67.321|POST /wp-admin/async-upload.php HTTP/1.1
18/Aug/2017:00:30:49 +0000|v1|104.54.207.40|techgirlkb.guru|200|644|127.0.0.1:6788|62.343|63.828|POST /wp-admin/async-upload.php HTTP/1.1
18/Aug/2017:00:30:56 +0000|v1|104.54.207.40|techgirlkb.guru|200|642|127.0.0.1:6788|61.613|64.402|POST /wp-admin/async-upload.php HTTP/1.1

Bash Tips and Tricks

When creating commands for searching your logs, there are a few best practices to keep in mind. We’ll cover some tips that apply to searching access logs below.

cat filename | grep pattern – never cat a single file and pipe to a grep. The cat command is made to concatenate the contents of multiple files. It’s much more efficient to use a format like: grep “pattern” filename

expr and seq – don’t use outdated scripting methods. Some examples would be expr and seq. For seq, counting is now built into bash, so it’s no longer needed. And expr is inefficient in that is written for outdated shell systems. In these older systems, expr starts a process that calls other programs to do the requested work. In general, it’s best practice to use newer and more efficient methods when making scripts.

ls -l | awk ‘{ print $8 }’ – If you’re searching for a filename within a directory, never parse the output of ls! The ls command is not consistent in its output across various platforms, meaning running it in one environment may offer far different results from another environment. And since some file names can contain a new line, this causes weird output in some cases as well.

For more best practices when writing scripts, check out this Bash FAQ.


Happy log crunching! I hope these tips and quick commands help you understand the output of your access logs, and help you build your own scripts to do the same. Have any other quick one-liners you use to search your logs? Let me know in the comments, or contact me.


The Anatomy of a DDoS

What does DDoS stand for?

First, let’s define the term “DDoS.” DDoS stands for “Distributed Denial of Service.” The concept behind a targeted DDoS attack is: overwhelm a server or site’s resources in order to bring it down. There can be many reasons behind a DDoS: personal vendettas, political disputes, disagreements, getting past security or firewall barriers, or even just for “fun.”

The effects of a DDoS attack can be truly devastating. Beyond server downtime, companies can suffer brand damage, bandwidth/usage overages, and more.

How do DDoS attacks happen?

So how would one go about overwhelming a server’s resources? Most commonly this happens by attackers building a “botnet.” Botnets are typically a series of malware-infected machines connecting to the internet. Attackers will try to add devices like routers, computers, web servers and more to their botnet. A common method for this is to use “brute force” methods to hack into your site or device. Once a device is infected with malware, the attacker can direct the “army” of infected devices to send thousands of simultaneous requests to a site. As a result, one attacker can bring an entire site crumbling down.

a ddos
Source: Incapsula

The tricky part about the DDoS method is that the requests are coming from a wide range of IP addresses and user-agents. In this way, the attack is “distributed.” With this method the attack is coming from a vast network of devices. There is also a term “DoS” which just stands for “Denial of Service.” Plain “DoS” attacks originate from the same IP address. With this method, security systems are easily able to detect and block the attack. The system simply has to block the IP address to thwart the attack.

DDoS Mitigation

Once a DDoS is started, it’s pretty hard to mitigate the attack. Usually by the time an attack starts, the attacker knows the origin IP address where your site’s content resides. So by the time you get behind a service like CloudFlare or another Reverse Proxy service, it’s too late. While these services “hide” the origin IP address so attackers can’t see it. However, if they’ve found it already, the damage is done. In this case, you’ll need to get behind a DDoS protection service and then move your origin server and update DNS records.

Some common DDoS protection services include:

CloudFlare Business/Enterprise

Sucuri CloudProxy

Imperva Incapsula

Akamai Prolexic

The services above are great to use in preparation of an attack. If you’re already being attacked by a DDoS you would need to implement a service above and then change IP addresses. Or, you can use HiveShield from HiveWind, which can be deployed inside your current infrastructure. You can activate HiveShield even when your site is already being attacked. It will automatically begin deflecting the bad actors without needing to change Origin IPs. This is what sets HiveShield apart from its competitors.


If you want to try HiveShield DDoS protection on your own server, use the coupon code TCHGRLKB. This coupon code is good for 8 cores/$50 a month OR 16 cores/$100 a month, each with a free 30 day trial – a 50% savings!


Whichever service you use, be sure you use one to protect your site now! This way you’re protected against DDoS attacks. And, you won’t have to scramble to move your origin server if you’re attacked. So, which of these services is best? Read up, compare, and find which one is right for your business needs!

Have more questions about security? Is there a topic I didn’t cover? Feel free to let me know in the comments, or contact me.

Troubleshooting High Server Load

Why does server load matter?

High server load is an issue that can affect any website. Some symptoms of high server load include: slow performance, site errors, and sometimes even site down responses. Troubleshooting high server load requires SSH access to the server where your site resides.

What is high server load?

First, you’ll want to find out: is my server’s load high? Server load is relative to the amount of CPU cores on said server. If your server has 4 cores, a load of “4” means you’re utilizing 100% available CPU. So first, you’ll want to find out how many cores your server has.

nproc – This command says to simply print the number of CPU cores. Quick and easy!

$ nproc
8

htop – This command will bring up a live monitor of your server’s resources and active processes. The htop command will show you a lot of information, including the number of cores on your server. The numbered rows are the CPU cores:

Now that we know how many CPU cores are on the server, we can find out: what is the load? There’s a few methods to find out:

uptime – This command will simply print what the current load is, the date and time, and how long the server has gone without rebooting. The numbers after “load average” indicates your server’s load average for the past minute, five minutes, and fifteen minutes respectively.

$ uptime
17:46:44 up 19 days, 15:25, 1 user, load average: 1.19, 1.01, 1.09

sar -q – This command will not only show you the current load for the last one, five, and fifteen minutes. It will show you the output of this command for every five minutes on the server since the beginning of the day.

htop – Just like finding the number of cores, htop will show you how many of the cores are being utilized (visually), and print the load average for the past one, five, and fifteen minutes.

With just this information, I can see that the server example given does not have high server load. The load average has been between 1-2 today, and my server has 8 cores. So we’re seeing about a 25% max load on this server.

My server’s load is high! What now?

If you’ve used the above steps to identify high CPU load on your server, it’s time to find out why the load is high. The best place to start is again, htop. Look in the output below the number of cores and load average. This will show you the processes on your server, sorted by the percentage of CPU they’re using. Here’s an example:

In this example we can see that there’s a long list of apache threads open! So much so, the server’s load is nearly 100. One of the key traits with Apache is knowing that each concurrent request on your website will open a new Apache thread, which uses more CPU and Memory. You can check out my blog post on Nginx vs Apache for more details on the architecture. In short, this means too many Apache threads are open at once.

So let’s see what’s currently running in Apache!

High load from Apache processes

lynx server-status – When using the Lynx you can see a plain text view of a webpage. This might not sound all that useful, but in the case of server load, there’s a module called mod_status that you can monitor with this. For a full breakdown, check out Tecmint’s overview of apache web server statistics.

lynx http://localhost:6789/server-status

If you’re checking this on your server, be sure to route the request to the port where Apache is running (in my case it’s 6789). Look at the output to see if there are any patterns – are there any of the same kind of request repeated? Is there a specific site or VHost making the most requests?

Once you’ve taken a look at what’s currently running, it’ll give you an idea of how to best search your access logs. Here’s some helpful access-log searching commands if you’re using the standard Apache-formatted logs:

Find the largest access log file for today (identify a site that’s hitting Apache hard):

ls -laSh /var/log/apache2/*.access.log | head -20 | awk '{ print $5,$(NF) }' | sed -e "s_/var/log/apache2/__" -e "s_.access.log__" | column -t

(be sure to change out the path for the real path to your access logs – check out the list of access log locations for more help finding your logs).

Find the top requests to Apache on a specific site (change out the log path with the info from the link above if needed):

cut -d' ' -f7 /var/log/apache2/SITENAME.access.log | sort | uniq -c | sort -rn | head -20

Find the top user-agents hitting your site:

cut -d'"' -f6 /var/log/apache2/SITENAME.apachestyle.log | sort | uniq -c | sort -rn | head -20

Find the top IP addresses hitting your site:

cut -d' ' -f1 /var/log/apache2/SITENAME.apachestyle.log | sort | uniq -c | sort -rn | head -25 | column -t

High load from MySQL

The other most common offender for high load and high Memory usage is MySQL. If sites on your server are running a large number of queries to MySQL at the same time, it could cause high Memory usage on the server. If MySQL uses more Memory than it’s allotted, it will begin to write to swap, which is an I/O process. Eventually, servers will begin to throttle the I/O processes, causing the processes waiting on those queries to stall. This adds even more CPU load, until the server load is destructively high and the server needs to be rebooted. Check out the InnoDB vs MyISAM section of my blog post for more information on this.

In the above example, you can see the Memory being over utilized by MySQL – the bottom left column at the top indicates swap usage. The server is using so much swap it’s almost maxed out! If you’re running htop and notice the highest user of CPU is a mysql process, it’s time to bring out mytop to monitor the active queries being run.

mytop – This is an active query monitor tool. Often times you’ll need to run this command with sudo, for reference. Check out Digital Ocean’s documentation to get mytop up and running.

This can help you track down what queries are slow, and where they’re coming from. Maybe it’s a plugin or theme on your site, or a daily cron job. In the example above, crons were responsible for the long queries to the “asterisk” database.

Other causes of high load

On top of Apache and MySQL, there’s definitely other causes of poor performance. Always start with htop to identify the bad actors causing high load. It might be server-level crons running, sleep-state processes waiting too long to complete, writing to logs, or any number of things. From there you can narrow your search until you’ve identified the cause, so you can work towards a solution!

While there can be many causes of high server load, I hope this article has been helpful to identify a few key ways to troubleshoot the top offenders. Have any input or other advice when troubleshooting high server load? Let me know in the comments, or contact me.


Streamline Your Workflow with WP-CLI for WordPress

What is WP-CLI?

WP-CLI is the command-line interface for WordPress. What makes WP-CLI useful is the ability to perform administrative actions without actually having to load the WordPress backend. You can use WP-CLI to manage your sites in a more efficient way! You can perform actions in bulk, manage plugins and themes, search and replace your database, and more.

Before getting started, you’ll need to install WP-CLI. This guide assumes you have SSH access to the site where your site is hosted (a requirement to use WP-CLI). From there, use the Quick Start guide to jumpstart your WP-CLI experience.

What can WP-CLI do?

You’d find a shorter list when looking at what WP-CLI can’t do! I’ll cover some of the basics in sections below.

Plugin and Theme Management

WP-CLI allows you to install, activate, deactivate, and update plugins and themes. Keep in mind, when WP-CLI runs it does still load your plugins and themes. If the code in one of your plugins or your theme is triggering a fatal error, this prevents the WP-CLI command from running. You may use WP-CLI to run a command that fails because of a fatal error. In this case read the error output to see whether it’s a plugin or theme causing the issue. If it’s a plugin, add the flag “–skip-plugins” to the end of your command. Or if it’s a theme, add “–skip-themes” to the end.

Here’s a couple examples of things you can run:

$ wp plugin deactivate akismet
Plugin 'akismet' deactivated.
Success: Deactivated 1 of 1 plugins.

$ wp plugin activate akismet
Plugin 'akismet' activated.
Success: Activated 1 of 1 plugins.

$ wp plugin update ewww-image-optimizer-cloud
Enabling Maintenance mode...
Downloading update from https://downloads.wordpress.org/plugin/ewww-image-optimizer-cloud.3.6.1.zip...
Unpacking the update...
Installing the latest version...
Removing the old version of the plugin...
Plugin updated successfully.
Disabling Maintenance mode...
Success: Updated 1 of 1 plugins.
+----------------------------+-------------+-------------+---------+
| name | old_version | new_version | status |
+----------------------------+-------------+-------------+---------+
| ewww-image-optimizer-cloud | 3.6.0 | 3.6.1 | Updated |
+----------------------------+-------------+-------------+---------+

$ wp theme list
+-----------------+----------+--------+---------+
| name | status | update | version |
+-----------------+----------+--------+---------+
| madhat | active | none | 1.0.5 |
| twentyfifteen | inactive | none | 1.8 |
| twentyseventeen | inactive | none | 1.3 |
| twentysixteen | inactive | none | 1.3 |
+-----------------+----------+--------+---------+

Database management

WP-CLI can also help manage your database. Some functions it can handle include: setting and deleting transients, search and replace, import and export databases, run queries, optimize tables, and manage your wp_options table. WP-CLI will use the database credentials found in your wp-config.php file to communicate with the database. With that in mind, be sure you confirm you have the right credentials in the wp-config.php file before running database commands!

Here are some examples of database functions you can run:

$ wp transient delete --all
Success: 5 transients deleted from the database.
Warning: Transients are stored in an external object cache, and this command only deletes those stored in the database. You must flush the cache to delete all transients.

$ wp db query "SELECT ID FROM wp_posts WHERE post_name LIKE '%database%';"
+----+
| ID |
+----+
| 57 |
+----+

$ wp db export mysite.sql
Success: Exported to 'mysite.sql'.

WordPress core

Using WP-CLI you can also manage WordPress core files. You can check the current version of WordPress, install WordPress core, update your version, revert back to a specific version, convert to Multisite, manage the wp-config.php file, and even verify that WordPress core matches checksums. When reverting down to a specific WordPress version, you’ll need to make sure to add the “–force” global flag.

Below are some examples of WordPress core-related WP-CLI commands:

$ wp core version
4.8.1

$ wp core update --version=4.8 --force
Updating to version 4.8 (en_US)...
Downloading update from https://wordpress.org/wordpress-4.8.zip...
Unpacking the update...
Success: WordPress updated successfully.

$ wp core update
Updating to version 4.8.1 (en_US)...
Downloading update from https://downloads.wordpress.org/release/wordpress-4.8.1-partial-0.zip...
Unpacking the update...
Success: WordPress updated successfully.

Manage cron jobs

If you use WP-CLI, you can manage scheduled events on your site easily, without needing an extra plugin. You can check what events are scheduled, manually execute cron jobs, verify the status of WP-Cron, and delete cron jobs.

Here are some examples:

$ wp cron event list
+------------------------------------------+---------------------+-----------------------+------------+
| hook | next_run_gmt | next_run_relative | recurrence |
+------------------------------------------+---------------------+-----------------------+------------+
| jetpack_display_posts_widget_cron_update | 2017-08-15 22:56:23 | 2 minutes 49 seconds | 10 minutes |
| jetpack_sync_cron | 2017-08-15 22:56:30 | 2 minutes 56 seconds | 5 minutes |
| jetpack_sync_full_cron | 2017-08-15 22:56:30 | 2 minutes 56 seconds | 5 minutes |
| jetpack_clean_nonces | 2017-08-15 23:06:23 | 12 minutes 49 seconds | 1 hour |
| jetpack_v2_heartbeat | 2017-08-15 23:06:30 | 12 minutes 56 seconds | 1 day |
| jp_purge_transients_cron | 2017-08-15 23:08:19 | 14 minutes 45 seconds | 1 day |
| wp_scheduled_delete | 2017-08-16 03:33:54 | 4 hours 40 minutes | 1 day |
| abtf_cron | 2017-08-16 03:47:30 | 4 hours 53 minutes | 12 hours |
| wp_scheduled_auto_draft_delete | 2017-08-16 04:30:27 | 5 hours 36 minutes | 1 day |
| mc4wp_refresh_mailchimp_lists | 2017-08-16 05:09:00 | 6 hours 15 minutes | 1 day |
| wp_version_check | 2017-08-16 08:39:43 | 9 hours 46 minutes | 12 hours |
| wp_update_plugins | 2017-08-16 08:39:43 | 9 hours 46 minutes | 12 hours |
| wp_update_themes | 2017-08-16 08:39:43 | 9 hours 46 minutes | 12 hours |
| wpseo-reindex-links | 2017-08-16 13:21:40 | 14 hours 28 minutes | 1 day |
| ao_cachechecker | 2017-08-16 15:54:22 | 17 hours | 1 day |
| ewww_image_optimizer_site_report | 2017-08-16 16:01:40 | 17 hours 8 minutes | 1 day |
+------------------------------------------+---------------------+-----------------------+------------+

$ wp cron event run wp_version_check
Executed the cron event 'wp_version_check' in 2.054s.
Success: Executed a total of 1 cron event.

$ wp cron test
Success: WP-Cron spawning is working as expected.

Manage media and posts

On top of general WordPress, database, and plugin/theme management, you can use WP-CLI to also manage individual media, posts and post types, and importing/exporting WordPress site data via XML. If you’re missing specific image sizes, you can regenerate the thumbnails associated with any image. Be forewarned, if you have a lot of images this may take a long while!

Below you can find some examples of media and post management:

$ wp media regenerate --only-missing --yes
Found 116 images to regenerate.
1/116 No thumbnail regeneration needed for "deactivate_activate" (ID 160).
2/116 No thumbnail regeneration needed for "wp_plugin_list" (ID 159).
3/116 No thumbnail regeneration needed for "pexels-photo-190574" (ID 157).
[...]
115/116 No thumbnail regeneration needed for "cropped-17361942_10155125372797938_2032688595763223584_n.jpg" (ID 6).
116/116 Regenerated thumbnails for "17361942_10155125372797938_2032688595763223584_n" (ID 5).
Success: Regenerated 116 of 116 images.

$ wp post create --post_type=page --post_title="This is an example" --post_status="draft"
Success: Created post 161.

$ wp post delete 161
Success: Trashed post 161.

Manage users

Managing users can also be accomplished with WP-CLI. When you use WP-CLI, you can add new users, add capabilities and roles to users, add new user roles, change passwords, and import a list of users from CSV.

Here’s some example user management commands:

$ wp user create test [email protected] --role=subscriber
Success: Created user 3.
Password: **********

$ wp user delete test
--reassign parameter not passed. All associated posts will be deleted. Proceed? [y/n] y
Success: Removed user 3 from http://techgirlkb.guru.

Manage Multisite networks

If you manage multiple subsites in a Multisite network, you might run into trouble differentiating the above commands to tell them which subsite to run on. For this, WP-CLI has the “–url=” command. You can use WP-CLI to run any of the commands above on each individual site by adding this global flag. Additionally, you can manage super-admins, manage Multisite-specific meta fields in the database, convert a single site to a Multisite, and more.

Here’s an example of a standard command, run on one subsite of a multisite:

$ wp plugin list --url="test.janna.wpengine.com"
+-----------------------------+----------------+-----------+---------+
| name | status | update | version |
+-----------------------------+----------------+-----------+---------+
| akismet | active-network | available | 3.3.2 |
| autoptimize | active-network | available | 2.1.2 |
| bbpress | active-network | available | 2.5.12 |
| buddypress | active-network | available | 2.7.3 |
| cloudflare | active-network | available | 3.1.1 |
| contact-form-maker | active-network | available | 1.8.38 |
| cpt-bootstrap-carousel | active-network | none | 1.9.1 |
| get-the-image | active-network | none | 1.0.1 |
| jetpack | active-network | available | 4.4.2 |
| siteorigin-panels | inactive | available | 2.4.21 |
| soundcloud-is-gold | active-network | available | 2.3.3 |
| types | inactive | available | 2.2.5 |
| wordpress-https | inactive | none | 3.3.6 |
| wordpress-mu-domain-mapping | active-network | none | 0.5.5.1 |
| wp-image-carousel | active-network | none | 1.0.2 |
| wp-smushit | inactive | available | 2.5.2 |
| wptouch | inactive | available | 4.3.9 |
| youtube-embed-plus | active-network | available | 11.5 |
| slt-force-strong-passwords | must-use | none | 1.6.4 |
| stop-long-comments | must-use | none | 0.0.4 |
| mu-plugin | must-use | none | 3.2.1 |
+-----------------------------+----------------+-----------+---------+

And there’s more!

We’ve talked about a ton of stuff that WP-CLI can manage, but it can do even more. You can combine WP-CLI commands using basic bash skills and save the output of commands. You can add aliases for commonly-used commands so they’re easier to type.

There are also several plugins that have custom-coded their own WP-CLI commands. You can find a full list in the WP-CLI handbook. And, since WP-CLI is open source, you can create your own pull request if you think you’ve identified a bug or want to add a new feature.

To sum it up, WP-CLI is an incredibly powerful tool for WordPress admins to control their sites using command line. Using the tools it provides, you can manage bulk tasks that otherwise would take hours! For a complete list of the various commands you can use with WP-CLI, check out Commands.

What do you use WP-CLI for? Have any other uses that I missed? Feel free to leave a comment or contact me.

  • « Previous Page
  • Page 1
  • …
  • Page 3
  • Page 4
  • Page 5
  • Page 6
  • Page 7
  • Page 8
  • Next Page »

Footer

Categories

  • Ansible
  • AWS
  • Git
  • Linux
  • Optimization
  • Performance
  • PHP
  • Scalability
  • Security
  • Uncategorized
  • WordPress

Copyright © 2025 · Atmosphere Pro on Genesis Framework · WordPress · Log in