• Skip to main content
  • Skip to footer

TechGirlKB

Performance | Scalability | WordPress | Linux | Insights

  • Home
  • Speaking
  • Posts
    • Linux
    • Performance
    • Optimization
    • WordPress
    • Security
    • Scalability
  • About Janna Hilferty
  • Contact Me

Apache

Troubleshooting Broken Proxies

If you’re using a performance-optimized server ecosystem, there’s a good chance that you’re using at least one proxy relationship. Whether the proxy is from another server or firewall, or from one web server to another within the same environment, broken proxies can sometimes be nebulous to troubleshoot.

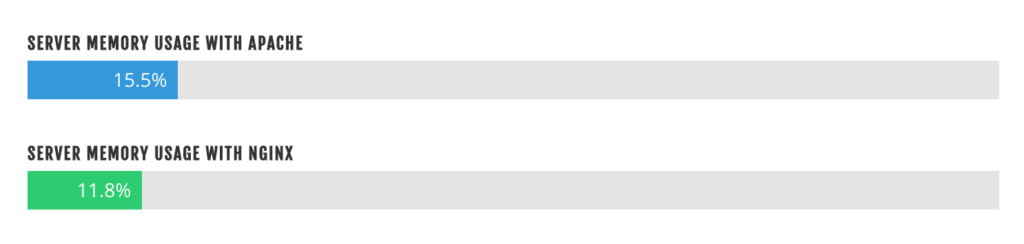
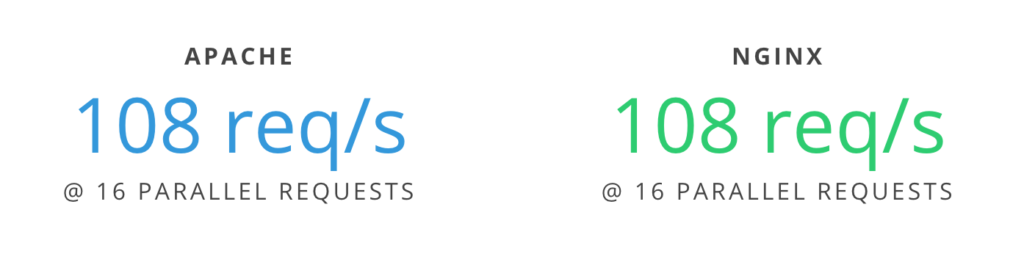
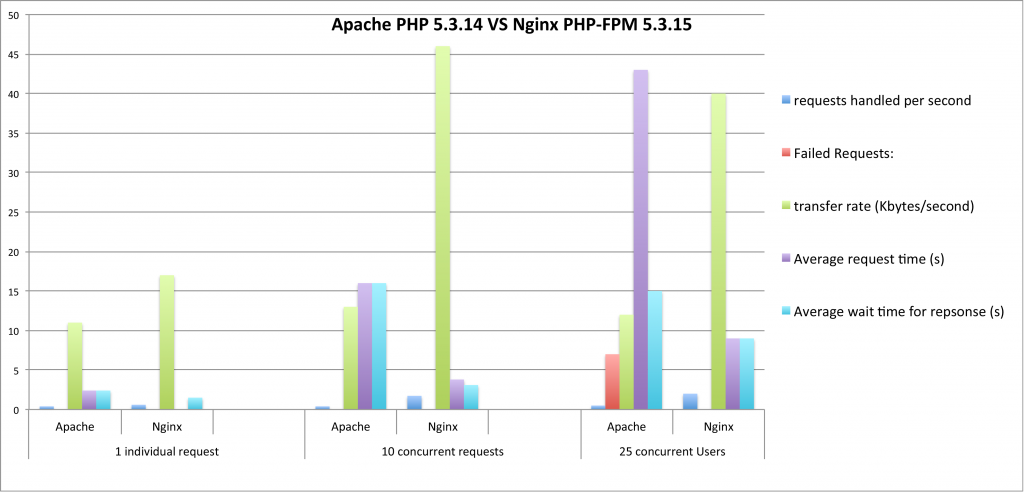
Today we’ll look specifically at the Nginx and Apache proxy relationship, when using both web servers. Curious about the benefits of using Nginx, Apache, or both? Check out the Web Server Showdown.

What is a proxy?

Before we dive in too far, let’s examine: what is a proxy? A proxy, sometimes referred to as an “application gateway,” is a web server that acts as an intermediary to another web server or service. In our example Nginx functions as a proxy server, passing requests to your caching mechanism or to Apache. Apache processes the request, passing it back to Nginx. Nginx in turn passes it to the original requestor.

What is a broken proxy?

Now that we understand the proxy, we can answer the question: what is a broken proxy? A broken proxy refers to when the intermediary service passes a request, but doesn’t get it back. So in our example, Nginx passes the request to Apache. Something happens at the Apache-level to where the request is now gone. Apache now has nothing to hand back to Nginx.

Nginx however is still responsible to the original requestor to tell them… something! It responds by telling the original requestor that it had a bad gateway (proxy) with a 502 or 504 HTTP Response.

Troubleshooting broken proxies

A common problem with proxies is that they can be difficult to troubleshoot. How do you know which service did not respond to the request Nginx (the proxy server) sent? And how do you know why the service did not complete the request?

A good place to start is your logs. Your Nginx error logs will indicate when an upstream error occurred, and may help offer some context, such as the port the request was sent to. These logs will usually be in the log path on your server (/var/log/nginx/ for many), labeled error.log.

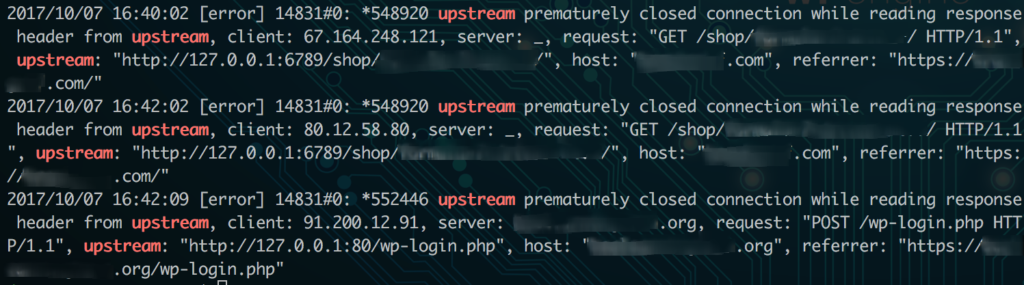
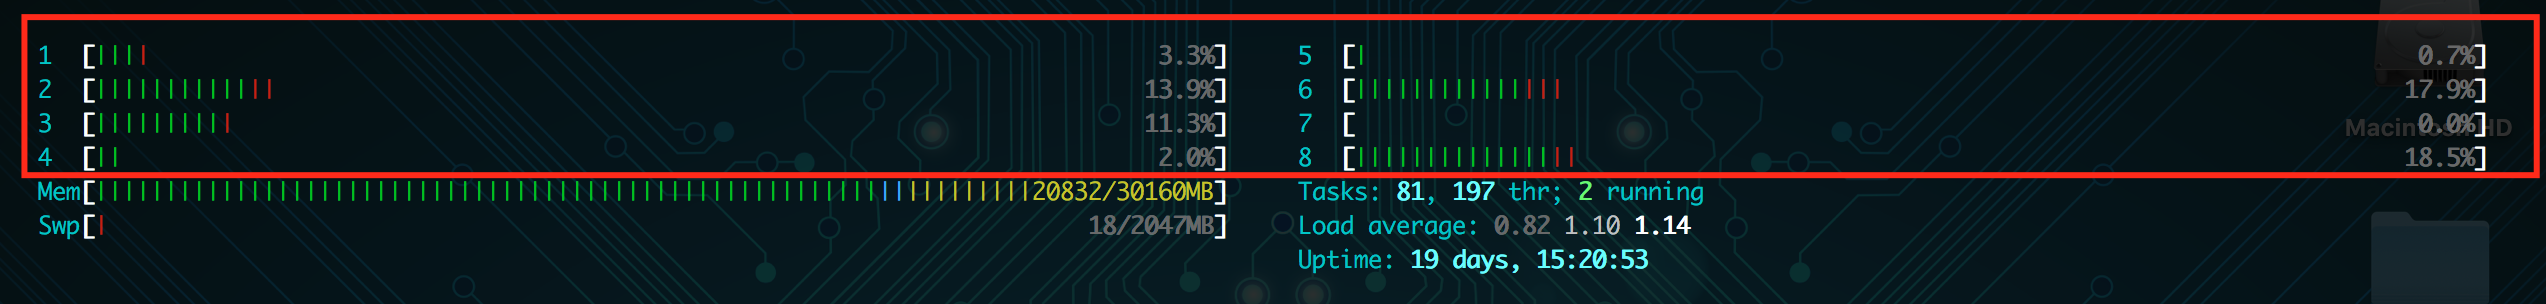
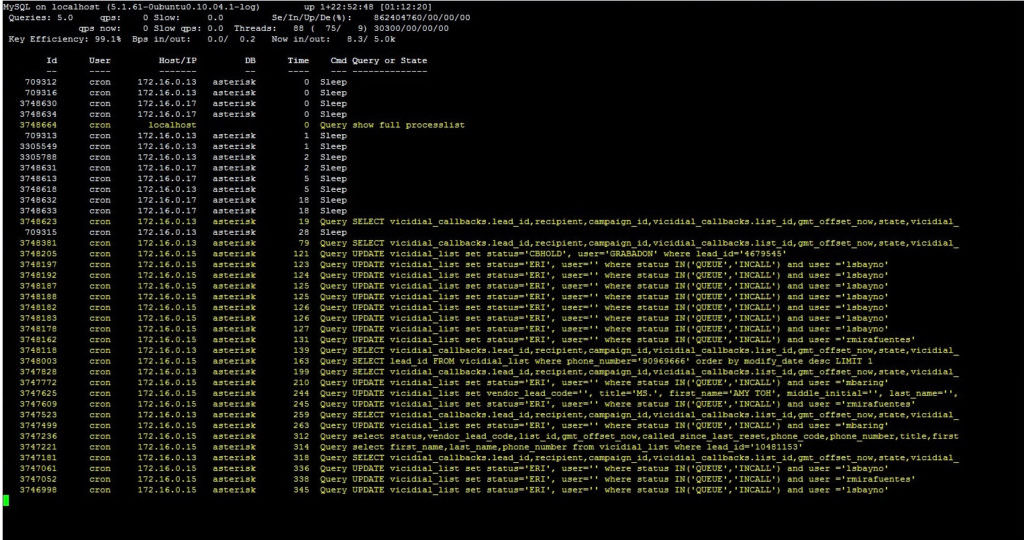
Your Nginx error log files will usually show which port produced the upstream error, which is your first clue. In my example, I can look for which service is running on that port. If I know Apache or my caching mechanism is operating on that port, I can know that service is responsible for the error.

6789 in the example in the picture was my Apache service, so I know Apache did not fulfill the request. Now I can check my Apache error logs for more information. These error logs are also generally where your logs are stored on the server, like /var/log/apache2/error.log. If you have multiple sites on the same server, you may have each site’s errors logged in separate files here instead.

Some common reasons Apache might not complete a request:

  • The request timed out (max_execution_time reached)
  • The request used too much Memory and was killed
  • A segmentation fault occurred
  • The Apache service is not on or currently restarting

Many times your Apache error logs will let you know if the above is causing the issue. If it doesn’t, you may need to consult your firewall or security services on the server to see if the requests were blocked for other security reasons.

Caveats

Keep in mind: even if Apache experiences errors (like a 500 error due to theme or plugin code), as long as Apache entirely processes the request it will simply pass this HTTP status code up to Nginx to serve to your users. So remember, 502 errors will typically only result if there is no response from Apache back to Nginx.

And also remember that broken proxies are not always within the same server environment. If you use a firewall or full site CDN service, the requests are proxied through these external servers as well. If you experience a 502 error and can’t find that request in your access logs, looking to the logs on your external firewall should be your next step.


Have you experienced issues with 502 errors on your server? What was the cause? Have any other solutions or recommendations to include? Let me know in the comments, or Contact Me.


Preventing Site Mirroring via Hotlinking

Introduction

If you’re a content manager for a site, chances are one of your worst nightmares is having another site completely mirror your own, effectively “stealing” your site’s SEO. Site mirroring is the concept of showing the exact same content and styles as another site. And unfortunately, it’s super easy for someone to do.

How is it done?

Site mirroring can be accomplished by using a combination of “static hotlinking” and some simple PHP code. Here’s an example:

Original site:

site mirroring


Mirrored site:

site mirroring


The sites look (almost) exactly the same! The developer on the mirrored site used this code to mirror the content:

<?php
//get site content
        $my_site = $_SERVER['HTTP_HOST'];
        $request_url = 'http://philipjewell.com' . $_SERVER['REQUEST_URI'];
        $ch = curl_init();
        curl_setopt($ch, CURLOPT_URL, $request_url);
        curl_setopt($ch, CURLOPT_FOLLOWLOCATION, true);
        curl_setopt($ch, CURLOPT_RETURNTRANSFER, TRUE);
        $site_content = curl_exec($ch); //get the contents of the site from this server by curling it
        //get all the href links and replace them with our domain so they don't navigate away
        $site_content = preg_replace('/href=(\'|\")https?:\/\/(www\.)?philipjewell.com/', 'href=\1https://'.$my_site, $site_content);
        $site_content = preg_replace('/Philip Jewell Designs/', 'What A Jerk Designs', $site_content);
        echo $site_content;
?>

Unfortunately it’s super simple with just tiny bits of code to mirror a site. But, luckily there are some easy ways to protect your site against this kind of issue.

Prevent Site Mirroring

There are a few key steps you can take on your site to prevent site mirroring. In this section we’ll cover several prevention method options for both Nginx and Apache web servers.

Disable hotlinking

The first and most simple is to prevent static hotlinking. This essentially means preventing other domains from referencing static files (like images) from your site on their own. If you host your site with WP Engine, simply contact support via chat to have them disable this for you. If you host elsewhere, you can use the below examples to see how to disable static hotlinking in Nginx and Apache. Both links provide more context into what each set of rules does for further information.

Nginx (goes in your Nginx config file)

location ~* \.(gif|png|jpe?g)$ {
expires 7d;
add_header Pragma public;
add_header Cache-Control "public, must-revalidate, proxy-revalidate";
# prevent hotlink
valid_referers none blocked ~.google. ~.bing. ~.yahoo. server_names ~($host);
if ($invalid_referer) {
rewrite (.*) /static/images/hotlink-denied.jpg redirect;
# drop the 'redirect' flag for redirect without URL change (internal rewrite)
}
}
# stop hotlink loop
location = /static/images/hotlink-denied.jpg { }

Apache (goes in .htaccess file)

RewriteEngine on
RewriteCond %{HTTP_REFERER} !^$
RewriteCond %{HTTP_REFERER} !^http(s)?://(www\.)?yourdomain.com [NC]
RewriteCond %{HTTP_REFERER} !^http(s)?://(www\.)?google.com [NC]
RewriteCond %{HTTP_REFERER} !^http(s)?://(www\.)?bing.com [NC]
RewriteCond %{HTTP_REFERER} !^http(s)?://(www\.)?yahoo.com [NC]
RewriteRule \.(jpg|jpeg|png|gif|svg)$ http://dropbox.com/hotlink-placeholder.jpg [NC,R,L]


Disable CORS/Strengthen HTTP access control

The above steps will help prevent others from linking to static files on your site. However, you’ll also want to either disable CORS (Cross Origin Resource Sharing), or strengthen your HTTP access control for your site.

CORS is the ability for other sites to reference links to your own site in their source code. By disabling this, you’re preventing other sites from displaying content hosted on your own site. You can be selective with CORS as well, to only allow references to your own CDN URL, or another one of your sites. Or you can disable it entirely if you prefer.

According to OWASP guidelines, CORS headers allowing everything (*) should only be present on files or pages available to the public. To restrict the sharing policy to only your site, try using these methods:

.htaccess (Apache):

Access-Control-Allow-Origin: http://www.example.com

This allows only www.example.com to access your site. You can also set this to be a wildcard value, like in this example.

Nginx config (Nginx):

add_header 'Access-Control-Allow-Origin' 'www\.example\.com';

This says to only allow requests from www.example.com. You can also be more specific with these rules, to only allow specific methods from specific domains.

Disable iframes

Another step you may want to take is disabling the ability for others to create iframes from your site. By using iframes, some users may believe content on an attacker’s site is legitimately from your site, and be misled into sharing personal information or downloading malware. Read more about X-Frame-Options on Mozilla’s developer page.

Use “SAMEORIGIN” if you wish to embed iframes on your own site, but don’t want any other sites to display content. And use “DENY” if you don’t use iframes on your own site, and don’t want anyone else to use iframes from your site.

Block IP addresses

Last, if you’ve discovered that another site is actively mirroring your own, you can also block the site’s IP address. This can be done with either Nginx or Apache. First, find the site’s IP address using the following:

dig +short baddomain.com

This will print out the IP address that the domain is resolving to. Make sure this is the IP address that shows in your site’s Nginx or Apache access logs for the mirrored site’s requests.

Next, put one of the following in place:

Apache (in .htaccess file):

Deny from 123.123.123.123

Nginx (in Nginx config):

deny 123.123.123.123;


File a DMCA Takedown Notice

Last, if someone is mirroring your site without your explicit approval or consent, you may also want to take action by filing a DMCA Takedown Notice. You can follow this DMCA guide for more information. The guide will walk you through finding the host of the domain mirroring your own site, and filing the notice with the proper group.


Thank you to Philip Jewell for collaborating on this article! And thanks for tuning in. If you have feedback, additional information about blocking mirrored sites drop a line in the comments or contact me.

Protecting Your Site From Content Injection

What is Content Injection?

Content Injection, otherwise known as Content Spoofing, is the act of manipulating what a user sees on a site by adding parameters to their URL. This act is a known form of attack on a website. While Content Injection and XSS (Cross Site Scripting) Attacks are similar, they differ in a few key ways. Firstly, XSS attacks specifically target users by using <script> parameters, mainly using JavaScript. Content Injection by comparison mainly relies on adding parameters to the end of a static URL (/login.php for example).

Here’s a basic example:

content injection

For static files like error pages (in this case a 400 error), attackers can manipulate the text on the page to say what they want. You’ll see in the URL bar that the attacker added extra text to the URL which made the error page print the text since it was part of the URL. Notice, they couldn’t make “www.hackersite.com” actually a clickable link in the basic output which is a good sign. But, easily misled visitors may still try to navigate to “www.hackersite.com” based on the text on this page. The general intent of content injection is usually phishing. Or in other words, getting users to enter their sensitive information by misleading them.

So what’s the fix?

In the interest of protecting your site from content injection on static files like the above, you’d want to use the “AllowEncodedSlashes” directive in Apache like so:

AllowEncodedSlashes NoDecode

With this directive you’re telling Apache to not necessarily show a 404 when “encoded slashes” like %2F and %5C in the URL are added, but instead to show the actual page that *should* have come up. Here’s an example from one of my own sites, with and without encoded slashes set to NoDecode:

content injection

And with the NoDecode directive set:

content injection

So, using the NoDecode option I’m able to let my users see the correct page, even if someone tried to manipulate the URL to print other text.

Another alternative would be to rewrite static files to your WordPress theme’s 404 page. This way users see your custom page instead of the default white-text static error pages (since they can be manipulated as we saw). This isn’t always the best option for all sites though. It all depends on how you want to handle requests with extra content added to the end.

These types of content injection are usually pretty low-risk. This is because all the attacker can do is manipulate text on specific files. If your site is being affected by XSS though, to where they are able to inject URL links and formatting on a page, that is a more serious concern. Use this guide to help prevent XSS on your site.


That’s all, folks! Have more input on content injection? More tips or tricks? Want to hear more? Let me know in the comments or contact me.


Deciphering Your Site’s Access Logs

Requirements

Searching your site’s access logs can be difficult! There’s a lot of information to visually take in, which means viewing the entire log entry can sometimes be overwhelming. In this article we’ll discuss ways to parse your access logs to better understand trends on your site!

Before we get started, let’s talk prerequisites. In order to use the bash commands we’ll discuss, you’ll need:

  • Apache and/or Nginx
  • SSH access to your server

Using grep, cut, sort, uniq, and awk

Before we dive into the logs themselves, let’s talk about how we’ll be parsing them. First, you’ll want to understand the bash commands we use to collect specific pieces of information from the logs.

cat

Used to “concatenate” two or more files together. In the case of searching access logs, we’d typically use it to print out results from two files together, to search for information in both. For example, if I wanted to print or search both today’s and yesterday’s logs.

zcat

Works the same as cat, but concatenates and prints out results of gzip (.gz) compressed files specifically.

grep

Use to search for a specific string or quote in a single file.

ack-grep

Used to find strings in a file or several files. The ack-grep command is more efficient than grep when looking for results in a directory or multiple files. And, unlike a standard grep, ack-grep prints out the specific line in which the text string was found. It’s also easier to only search in files of a specific kind, like PHP files for example.

cut

Used to cut out specific pieces of information, useful for sorting through grep results. Using the -d flag you can set a “delimiter” (dividing signal). And using the -f flag you can choose which field(s) separated by said delimiter to print out specifically.

sort

Sorts output results from lowest to highest, useful for sorting grep and cut results. You can use sort -rn to show results from highest to lowest instead.

uniq

Filters out repeating lines, most often used as uniq -c to get a count of unique results per entry. The uniq command filters out repeating lines by combining any repeated entries into a single result, to only show “unique” entries.

awk

A text processor for Unix –  typically used as a sorting mechanism by using awk -F (-F meaning “Field separator”).

head

Says to print the top 10 lines of the specified file(s). You can adjust the number of lines by adding the -n flag to the end, n meaning any number.

tail

Says to print the last 10 lines of the specified file(s). Similar to head, you can adjust the number of lines by adding the -n flag to the end, where n means any number. You can also use tail to live monitor access logs using tail -f logname.log.

find

Used to find files by a particular name, date, or extension type. You can use the flags -d to find directories, or -f to search files.

Apache access logs

So how do we put all the information above together? Let’s start by looking at the Apache access logs. Apache is the most commonly-used web server, so it’s a good place to start.

Before you get started, be sure to locate your access logs. Depending on the version of Linux you’re running, it could be in a slightly different location. On my server I’m using Ubuntu so my logs are found in the /var/log/apache2/ directory. Here’s an example of some of my Apache access logs for a reference point:

104.54.207.40 techgirlkb.guru - [18/Aug/2017:21:52:08 +0000] "GET /wp-content/uploads/2017/08/lynx_server_status_2.png HTTP/1.1" 200 223989 "http://techgirlkb.guru/2017/08/troubleshooting-high-server-load/" "Mozilla/5.0 (Macintosh; Intel Mac OS X 10_12_6) AppleWebKit/537.36 (KHTML, like Gecko) Chrome/59.0.3071.115 Safari/537.36"
104.54.207.40 techgirlkb.guru - [18/Aug/2017:21:52:08 +0000] "GET /wp-content/uploads/2017/08/sar-q-output-768x643.png HTTP/1.1" 200 357286 "http://techgirlkb.guru/2017/08/troubleshooting-high-server-load/" "Mozilla/5.0 (Macintosh; Intel Mac OS X 10_12_6) AppleWebKit/537.36 (KHTML, like Gecko) Chrome/59.0.3071.115 Safari/537.36"
104.54.207.40 techgirlkb.guru - [18/Aug/2017:21:52:08 +0000] "GET /wp-content/cache/autoptimize/js/autoptimize_a60c72b796d777751fdd13d6f0375f9c.js HTTP/1.1" 200 49995 "http://techgirlkb.guru/2017/08/troubleshooting-high-server-load/" "Mozilla/5.0 (Macintosh; Intel Mac OS X 10_12_6) AppleWebKit/537.36 (KHTML, like Gecko) Chrome/59.0.3071.115 Safari/537.36"
104.54.207.40 techgirlkb.guru - [18/Aug/2017:21:52:09 +0000] "GET /wp-content/uploads/2017/08/htop_mysql_usage.png HTTP/1.1" 200 456536 "http://techgirlkb.guru/2017/08/troubleshooting-high-server-load/" "Mozilla/5.0 (Macintosh; Intel Mac OS X 10_12_6) AppleWebKit/537.36 (KHTML, like Gecko) Chrome/59.0.3071.115 Safari/537.36"
104.54.207.40 techgirlkb.guru - [18/Aug/2017:21:52:09 +0000] "GET /wp-content/uploads/2017/08/mytop.jpg HTTP/1.1" 200 417613 "http://techgirlkb.guru/2017/08/troubleshooting-high-server-load/" "Mozilla/5.0 (Macintosh; Intel Mac OS X 10_12_6) AppleWebKit/537.36 (KHTML, like Gecko) Chrome/59.0.3071.115 Safari/537.36"

Totals of HTTP response codes

cut -d' ' -f9 techgirlkb.access.log | sort | uniq -c | sort -rn

This command says, using space (‘ ‘) as a delimiter, print the 9th field from techgirlkb.access.log. Then sort says to arrange the results lowest to highest, uniq -c says to combine all the same response codes into one entry and get a count, and then the sort -rn says to then sort your results from highest to lowest count. You should get an output like this:

1663 200
78 499
58 302
33 404
29 301
18 444
12 206
3 304
2 403
1 416

Hits to Apache per hour

awk -F'[' '{print $2 }' techgirlkb.access.log | awk -F: '{ print "Time: " $1,$2 ":00" }' | sort | uniq -c | more
This command says, using ‘[‘ as a delimiter, print the 2nd field from my Apache access log. Then with that output, using ‘:’ as a delimiter print the word “Time :” followed by the 1st and 2nd fields followed by “:00”. This allows you to group the requests in the hour together and get a count. You should get an output that looks like this:

293 Time: 18/Aug/2017 00:00
78 Time: 18/Aug/2017 01:00
188 Time: 18/Aug/2017 02:00
79 Time: 18/Aug/2017 03:00
27 Time: 18/Aug/2017 04:00
14 Time: 18/Aug/2017 05:00
40 Time: 18/Aug/2017 06:00
4 Time: 18/Aug/2017 07:00
74 Time: 18/Aug/2017 08:00

Top requests to Apache for today and yesterday

cat techgirlkb.access.log techgirlkb.access.log.1 | cut -d' ' -f7 | sort | uniq -c | sort -rn | head -20

This command says to concatenate today and yesterday’s access logs. Then, using space as the delimiter, print the 7th field. With that output, sort from lowest to highest, group like entries together, sort them by the count and then print the top 20 results. Your output should look something like this:

202 /wp-admin/admin-ajax.php
59 /feed/
49 /2017/08/troubleshooting-high-server-load/
37 /2017/08/the-anatomy-of-a-ddos/
33 /

Top IPs to hit the site today and yesterday

cat techgirlkb.access.log techgirlkb.access.log.1 | cut -d' ' -f1 | sort | uniq -c | sort -rn | head -25

This command says to concatenate the logs for today and yesterday. Then, with the output using space as a delimiter, print the 1st field. Sort and group your results together to get the list of the top 25 IPs. Here’s an example output:

343 104.54.207.40
341 104.196.38.166
114 66.162.212.19
75 38.140.212.19
56 173.212.242.97
46 5.9.106.230
45 173.212.203.245

Top User-Agents to hit the site today and yesterday

cat techgirlkb.access.log techgirlkb.access.log.1 | cut -d'"' -f6 | sort | uniq -c | sort -rn | head -20

This command says to concatenate today’s and yesterday’s logs. Then with the output, using double quotes (“) as the delimiter, print the 6th field. Sort and combine the results, printing the top 20 unique User-Agent strings.

628 Mozilla/5.0 (Macintosh; Intel Mac OS X 10_12_6) AppleWebKit/537.36 (KHTML, like Gecko) Chrome/59.0.3071.115 Safari/537.36
339 WordPress/4.8.1; http://techgirlkb.guru
230 Mozilla/5.0 (Macintosh; Intel Mac OS X 10_12_6) AppleWebKit/537.36 (KHTML, like Gecko) Chrome/60.0.3112.90 Safari/537.36
230 Mozilla/5.0 (compatible; MJ12bot/v1.4.7; http://mj12bot.com/)
209 Mozilla/5.0 (compatible; Googlebot/2.1; +http://www.google.com/bot.html)

Top HTTP referrers to the site today

cut -d'"' -f4 techgirlkb.access.log | sort | uniq -c | sort -rn | head -20

This command says to print the 4th field (using ” as the delimiter), sort and combine into unique entries and get a count, then print the top 20 results. Here’s what your output should look like:

714 -
278 http://techgirlkb.guru/2017/08/the-anatomy-of-a-ddos/
151 http://techgirlkb.guru/wp-admin/post-new.php
100 http://techgirlkb.guru/wp-admin/options-general.php?page=NextScripts_SNAP.php
87 http://techgirlkb.guru/wp-admin/

Nginx access logs

If you use Nginx access logs, you’ll need to adjust your commands to match the log format. Here’s what my Nginx logs look like, for an example to gather data:

18/Aug/2017:22:31:41 +0000|v1|104.196.38.166|techgirlkb.guru|499|0|127.0.0.1:6789|-|0.996|POST /wp-cron.php?doing_wp_cron=1503095500.1473810672760009765625 HTTP/1.1
18/Aug/2017:22:31:42 +0000|v1|104.54.207.40|techgirlkb.guru|302|4|127.0.0.1:6788|2.941|3.109|POST /wp-admin/post.php HTTP/1.1
18/Aug/2017:22:31:43 +0000|v1|104.54.207.40|techgirlkb.guru|200|60419|127.0.0.1:6788|0.870|0.870|GET /wp-admin/post.php?post=182&action=edit&message=10 HTTP/1.1
18/Aug/2017:22:31:44 +0000|v1|104.54.207.40|techgirlkb.guru|200|1321|-|-|0.000|GET /wp-content/plugins/autoptimize/classes/static/toolbar.css?ver=1503095503 HTTP/1.1
18/Aug/2017:22:31:44 +0000|v1|104.54.207.40|techgirlkb.guru|404|564|-|-|0.000|GET /wp-content/plugins/above-the-fold-optimization/admin/css/admincp-global.min.css?ver=2.7.12 HTTP/1.1

Notice that in these access logs, most fields are separated by a pipe (|). We also have some additional information in these logs, like how long the request took and what port it was routed to. We can use this information to look at even more contextual data. Usually your Nginx access logs can be found in /var/log/nginx/.

Totals of HTTP response codes today

cut -d'|' -f5 techgirlkb.access.log | sort | uniq -c | sort -rn
This command says to print the 5th field using pipe (|) as a delimiter. Then, sort and combine the results into unique entries by count, and show us the results sorted highest to lowest frequency. Your output should look something like this:

1751 200
113 499
59 302
34 404
29 301
18 444
12 206
3 304
2 403
1 416

Top requests to Nginx for today and yesterday

cut -d' ' -f3 techgirlkb.access.log | sort | uniq -c | sort -rn | head -20

This command says to use space as a delimiter, print the 3rd field. Then sort and combine the results, and print the top 20 results. Your output should look like this:

142 /wp-admin/admin-ajax.php
79 /wp-content/uploads/2017/08/staircase-600468_1280.jpg
54 /2017/08/the-anatomy-of-a-ddos/
53 /
41 /?url=https%3A//www.google-analytics.com/analytics.js&type=js&abtf-proxy=fd0703a0b1e757ef151b57e8dec02b32
32 /wp-includes/js/wp-emoji-release.min.js?ver=4.8.1
30 /robots.txt
30 /feed/

Show requests that took over 60 seconds to complete today

awk -F\| '{ if ($9 >= 60) print $0 }' techgirlkb.access.log
This command says, using pipe (|) as a delimiter, print the entire line only if the 9th field is greater than or equal to 60. The 9th field shows the response time in our Nginx logs. Your output should look something like this:

18/Aug/2017:00:30:45 +0000|v1|104.54.207.40|techgirlkb.guru|200|643|127.0.0.1:6788|63.400|67.321|POST /wp-admin/async-upload.php HTTP/1.1
18/Aug/2017:00:30:49 +0000|v1|104.54.207.40|techgirlkb.guru|200|644|127.0.0.1:6788|62.343|63.828|POST /wp-admin/async-upload.php HTTP/1.1
18/Aug/2017:00:30:56 +0000|v1|104.54.207.40|techgirlkb.guru|200|642|127.0.0.1:6788|61.613|64.402|POST /wp-admin/async-upload.php HTTP/1.1

Bash Tips and Tricks

When creating commands for searching your logs, there are a few best practices to keep in mind. We’ll cover some tips that apply to searching access logs below.

cat filename | grep pattern – never cat a single file and pipe to a grep. The cat command is made to concatenate the contents of multiple files. It’s much more efficient to use a format like: grep “pattern” filename

expr and seq – don’t use outdated scripting methods. Some examples would be expr and seq. For seq, counting is now built into bash, so it’s no longer needed. And expr is inefficient in that is written for outdated shell systems. In these older systems, expr starts a process that calls other programs to do the requested work. In general, it’s best practice to use newer and more efficient methods when making scripts.

ls -l | awk ‘{ print $8 }’ – If you’re searching for a filename within a directory, never parse the output of ls! The ls command is not consistent in its output across various platforms, meaning running it in one environment may offer far different results from another environment. And since some file names can contain a new line, this causes weird output in some cases as well.

For more best practices when writing scripts, check out this Bash FAQ.


Happy log crunching! I hope these tips and quick commands help you understand the output of your access logs, and help you build your own scripts to do the same. Have any other quick one-liners you use to search your logs? Let me know in the comments, or contact me.


Troubleshooting High Server Load

Why does server load matter?

High server load is an issue that can affect any website. Some symptoms of high server load include: slow performance, site errors, and sometimes even site down responses. Troubleshooting high server load requires SSH access to the server where your site resides.

What is high server load?

First, you’ll want to find out: is my server’s load high? Server load is relative to the amount of CPU cores on said server. If your server has 4 cores, a load of “4” means you’re utilizing 100% available CPU. So first, you’ll want to find out how many cores your server has.

nproc – This command says to simply print the number of CPU cores. Quick and easy!

$ nproc
8

htop – This command will bring up a live monitor of your server’s resources and active processes. The htop command will show you a lot of information, including the number of cores on your server. The numbered rows are the CPU cores:

Now that we know how many CPU cores are on the server, we can find out: what is the load? There’s a few methods to find out:

uptime – This command will simply print what the current load is, the date and time, and how long the server has gone without rebooting. The numbers after “load average” indicates your server’s load average for the past minute, five minutes, and fifteen minutes respectively.

$ uptime
17:46:44 up 19 days, 15:25, 1 user, load average: 1.19, 1.01, 1.09

sar -q – This command will not only show you the current load for the last one, five, and fifteen minutes. It will show you the output of this command for every five minutes on the server since the beginning of the day.

htop – Just like finding the number of cores, htop will show you how many of the cores are being utilized (visually), and print the load average for the past one, five, and fifteen minutes.

With just this information, I can see that the server example given does not have high server load. The load average has been between 1-2 today, and my server has 8 cores. So we’re seeing about a 25% max load on this server.

My server’s load is high! What now?

If you’ve used the above steps to identify high CPU load on your server, it’s time to find out why the load is high. The best place to start is again, htop. Look in the output below the number of cores and load average. This will show you the processes on your server, sorted by the percentage of CPU they’re using. Here’s an example:

In this example we can see that there’s a long list of apache threads open! So much so, the server’s load is nearly 100. One of the key traits with Apache is knowing that each concurrent request on your website will open a new Apache thread, which uses more CPU and Memory. You can check out my blog post on Nginx vs Apache for more details on the architecture. In short, this means too many Apache threads are open at once.

So let’s see what’s currently running in Apache!

High load from Apache processes

lynx server-status – When using the Lynx you can see a plain text view of a webpage. This might not sound all that useful, but in the case of server load, there’s a module called mod_status that you can monitor with this. For a full breakdown, check out Tecmint’s overview of apache web server statistics.

lynx http://localhost:6789/server-status

If you’re checking this on your server, be sure to route the request to the port where Apache is running (in my case it’s 6789). Look at the output to see if there are any patterns – are there any of the same kind of request repeated? Is there a specific site or VHost making the most requests?

Once you’ve taken a look at what’s currently running, it’ll give you an idea of how to best search your access logs. Here’s some helpful access-log searching commands if you’re using the standard Apache-formatted logs:

Find the largest access log file for today (identify a site that’s hitting Apache hard):

ls -laSh /var/log/apache2/*.access.log | head -20 | awk '{ print $5,$(NF) }' | sed -e "s_/var/log/apache2/__" -e "s_.access.log__" | column -t

(be sure to change out the path for the real path to your access logs – check out the list of access log locations for more help finding your logs).

Find the top requests to Apache on a specific site (change out the log path with the info from the link above if needed):

cut -d' ' -f7 /var/log/apache2/SITENAME.access.log | sort | uniq -c | sort -rn | head -20

Find the top user-agents hitting your site:

cut -d'"' -f6 /var/log/apache2/SITENAME.apachestyle.log | sort | uniq -c | sort -rn | head -20

Find the top IP addresses hitting your site:

cut -d' ' -f1 /var/log/apache2/SITENAME.apachestyle.log | sort | uniq -c | sort -rn | head -25 | column -t

High load from MySQL

The other most common offender for high load and high Memory usage is MySQL. If sites on your server are running a large number of queries to MySQL at the same time, it could cause high Memory usage on the server. If MySQL uses more Memory than it’s allotted, it will begin to write to swap, which is an I/O process. Eventually, servers will begin to throttle the I/O processes, causing the processes waiting on those queries to stall. This adds even more CPU load, until the server load is destructively high and the server needs to be rebooted. Check out the InnoDB vs MyISAM section of my blog post for more information on this.

In the above example, you can see the Memory being over utilized by MySQL – the bottom left column at the top indicates swap usage. The server is using so much swap it’s almost maxed out! If you’re running htop and notice the highest user of CPU is a mysql process, it’s time to bring out mytop to monitor the active queries being run.

mytop – This is an active query monitor tool. Often times you’ll need to run this command with sudo, for reference. Check out Digital Ocean’s documentation to get mytop up and running.

This can help you track down what queries are slow, and where they’re coming from. Maybe it’s a plugin or theme on your site, or a daily cron job. In the example above, crons were responsible for the long queries to the “asterisk” database.

Other causes of high load

On top of Apache and MySQL, there’s definitely other causes of poor performance. Always start with htop to identify the bad actors causing high load. It might be server-level crons running, sleep-state processes waiting too long to complete, writing to logs, or any number of things. From there you can narrow your search until you’ve identified the cause, so you can work towards a solution!

While there can be many causes of high server load, I hope this article has been helpful to identify a few key ways to troubleshoot the top offenders. Have any input or other advice when troubleshooting high server load? Let me know in the comments, or contact me.


Apache or Nginx: The Web Server Showdown

Whether to use Apache or Nginx in your server stack is a decade-old question. While both web servers are versatile and open-source, both offer some pros and cons worth considering. Below I’ll break down some of the key differences between the two.


Architecture

One of the first aspects to consider is the way each web server handles requests. On Apache, there are several “multi-processing model” options to choose from. The most common is called “prefork” – in this model, there is a parent Apache process, with multiple “child” processes. With each new request that comes to the site, it opens a new “child” process. This allows your server to kill child processes in the form of individual requests, rather than having to kill the entire Apache service.

source: zope.org

With Nginx, the master process exists with any number of “worker” processes. However, the largest difference comes in that each “worker” can handle multiple (read: thousands) of page/resource requests at a time, without having to engage the other worker processes. This frees up the server resources that these worker processes would have used, to allow other services to use the Memory and CPU more dynamically. Nginx’s architecture allows the server to process high amounts of traffic while still leaving Memory unused, compared to Apache’s single-request-per-thread method.

Source: www.thegeekstuff.com

Compatibility

When Apache was built in 1995, it was an early success. Developers chose this web server model because of its flexibility and wide library of dynamically-loaded modules to extend its capabilities. By a year in, Apache dominated the web server markets by far. Because of its wide adoption rate, Apache documentation is vast. Many other software models integrate with and support Apache as a result.

Igor Sysoev originally developed Nginx in 2004 to be a web server to be used in combination with Apache. It was launched as a solution for sites which needed to serve thousands of simultaneous requests, which was a new horizon for the world wide web. As Apache’s adoption grew steadily, more modules extending its capabilities were released. When developers realized how lightweight the architecture ran on their hardware, it was an easy choice to begin using Nginx for static and dynamic requests.

As of today, Apache still holds about 50% market share of web servers, while Nginx holds about 35%.

Performance

When considering performance for Apache or Nginx, two main categories exist: static files, and dynamic content. Static files are files which don’t have to be regenerated when requested: images, css, fonts, and javascript. When your code constructs a page to be served, the content is dynamic. Other factors to consider here are: concurrent users, Memory used, transfer rate, and wait time.

In a base comparison of static files, Nginx is about twice as fast, and uses about 25% less memory:

Source: www.speedemy.com

And the same tester found that with dynamic requests, the web servers returned the responses in the exact same amount of time, when serving 16 concurrent requests:

Source: www.speedemy.com

However, remember the other aspects: what was the transfer rate? Do these results change with the number of concurrent users? Below is a comparison published by The Organic Agency:

Source: theorganicagency.com

You can see as the concurrent dynamic requests increase, so does the Apache response time. Nginx by contrast does show a load time increase as the concurrent users increase, but not nearly as much as Apache. Also consider the “failed requests” column which begins at about 25 concurrent users with Apache. Remember the architecture differences in how the servers handle multiple requests? This test is a clear indication of why Nginx is the model of choice for high-traffic environments.

Why not both?

Having trouble deciding whether you should use Apache or Nginx? Need versatility AND agility? No problem. There’s no reason you can’t use both web servers in your server stack. One common way to use both together is to use Nginx as a front-end server, and Apache as a back-end worker. This setup works because the performance disparity in the services is less noticeable for dynamic requests.

Using both servers allows Nginx to act as a “traffic director,” handling all requests initially. If the request is static, Nginx simply serves the file as-is. If the request is dynamic, Nginx uses a proxy_pass to send the request to the Apache web server. Apache processes the PHP and queries to generate the webpage, and sends it back up to Nginx to serve to your site’s visitor. If you’re looking to set this up on your own, check out Digital Ocean’s documentation on the subject.


Footer

Categories

  • Ansible
  • AWS
  • Git
  • Linux
  • Optimization
  • Performance
  • PHP
  • Scalability
  • Security
  • Uncategorized
  • WordPress

Copyright © 2025 · Atmosphere Pro on Genesis Framework · WordPress · Log in