• Skip to main content
  • Skip to footer

TechGirlKB

Performance | Scalability | WordPress | Linux | Insights

  • Home
  • Speaking
  • Posts
    • Linux
    • Performance
    • Optimization
    • WordPress
    • Security
    • Scalability
  • About Janna Hilferty
  • Contact Me

Performance

Resolving 502, 503, and 504 errors

If you’ve ever run into 502, 503, or 504 errors (we’ll refer to them as 50x errors from here on out), you probably know how frustrating they can be to troubleshoot. Learn what each means in this article!

What are 50x errors?

Let’s start at the beginning: what does a 50x error mean? According to the HTTP Status Code guide, here’s what each translates to:

502 Bad Gateway: “the server, while acting as a gateway or proxy, received an invalid response from the upstream server“

503 Service Unavailable: “the server is not ready to handle the request.”

504 Gateway Timeout: “the server, while acting as a gateway or proxy, cannot get a response in time.”

Those descriptions, unfortunately, aren’t specific enough to be very useful to most users.

Here’s how I would describe these errors:

A service (whichever service first received the request) attempted to forward it on to somewhere else (proxy/gateway), and didn’t get the response it expected.

The 502 error

In the case of a 502 error, the service which forwarded the request onward received an invalid response. This could mean that the request was killed on the receiving service processing the request, or that the service crashed while processing it. It could also mean it received another response that was considered invalid. The best source to look would be in the logs of the service that received the request (nginx, varnish, etc), and the logs of the upstream service to which it is proxying (apache, php-fpm, etc).

For example, in a current server setup I am managing, I have nginx sitting as essentially a “traffic director” or “reverse proxy” that receives traffic first on the server. It then forwards the request to backend processing service for PHP called php-fpm. When I received a 502 error, I saw an error like this in my nginx error logs:

2019/01/11 08:11:31 [error] 16467#0: *7599 recv() failed (104: Connection reset by peer) while reading response header from upstream, client: 10.0.0.1, server: localhost, request: "GET /example/authenticate?code=qwie2347jerijowerdsb23485763fsiduhwer HTTP/1.1", upstream: "fastcgi://unix:/run/php-fpm/www.sock:", host: "example.com"

This error tells me that nginx passed the request “upstream” to my php-fpm service, and did not receive response headers back (i.e. the request was killed). When looking in the php-fpm error logs, I saw the cause of my issue:

[11-Jan-2019 08:11:31] WARNING: [pool www] child 23857 exited on signal 11 (SIGSEGV) after 33293.155754 seconds from start
[11-Jan-2019 08:11:31] NOTICE: [pool www] child 20246 started

Notice the timestamps are exactly the same, confirming this request caused php-fpm to crash. In our case, the issue was corrupted cache – as soon as the cache files were cleared, the 502 error was gone. However, often times you will need to enable core dumps or strace the process to diagnose further. You can read more about that in my article on Segmentation Faults.

A 502 error could also mean the upstream service killed the process (a timeout for long processes, for example), or if the request is proxying between servers, that the destination server is unreachable.

The 503 error

A 503 error most often means the “upstream” server, or server receiving the request, is unavailable. I’ve most often experienced this error when using load balancers on AWS and Rackspace, and it almost always means that the server configured under the load balancer is out of service.

This happened to me once or twice when building new servers and disabling old ones, without adding the new configuration to the load balancer. The load balancer, with no healthy hosts assigned, receives a 503 error because it could not forward the request to any host.

Luckily this error is easily resolved, as long as you have the proper access to your web management console to edit the load balancer configuration! Simply add a healthy host into the configuration, save, and your change should take effect pretty quickly.

The 504 error

Last but not least, a 504 error means there was a gateway timeout. For services like Cloudflare, which sit in front of your website, this often means that the proxy service (Cloudflare in this example) timed out while waiting for a response from the “origin” server, or the server where your actual website content resides.

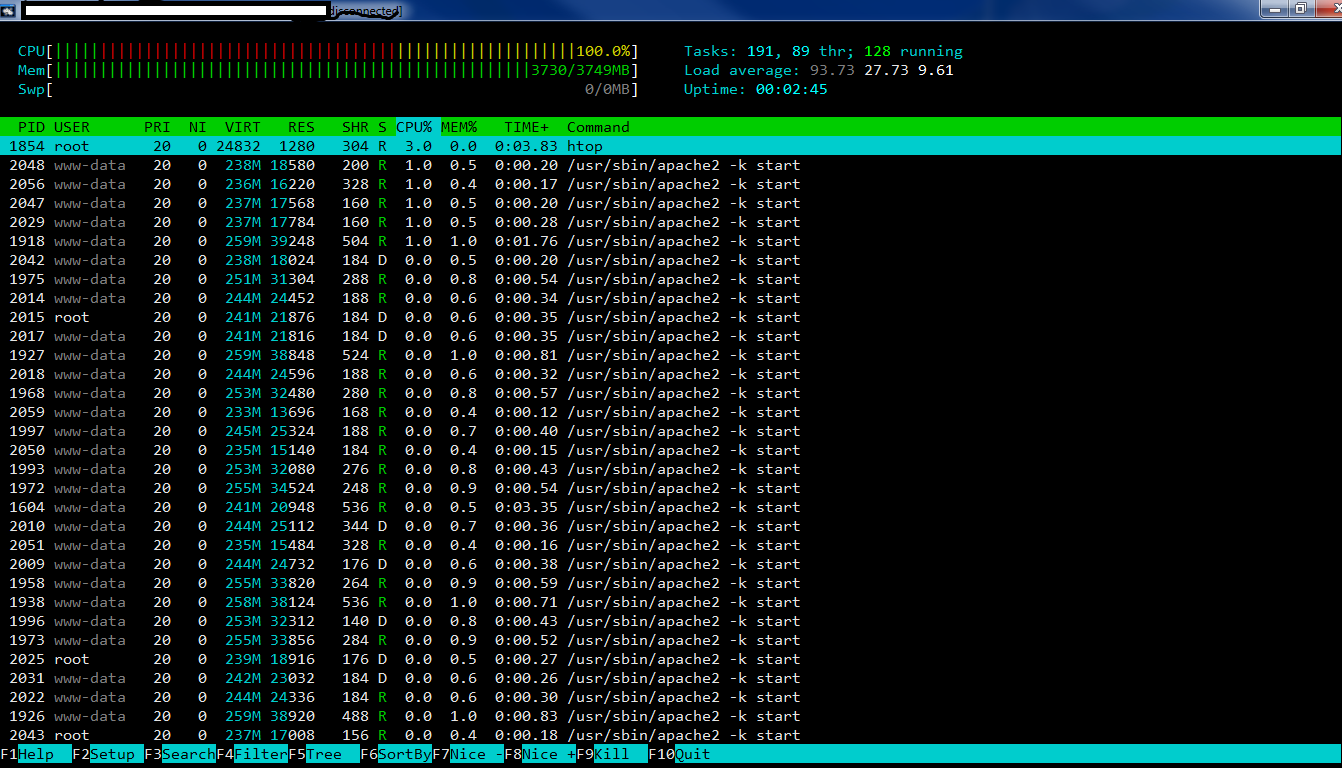
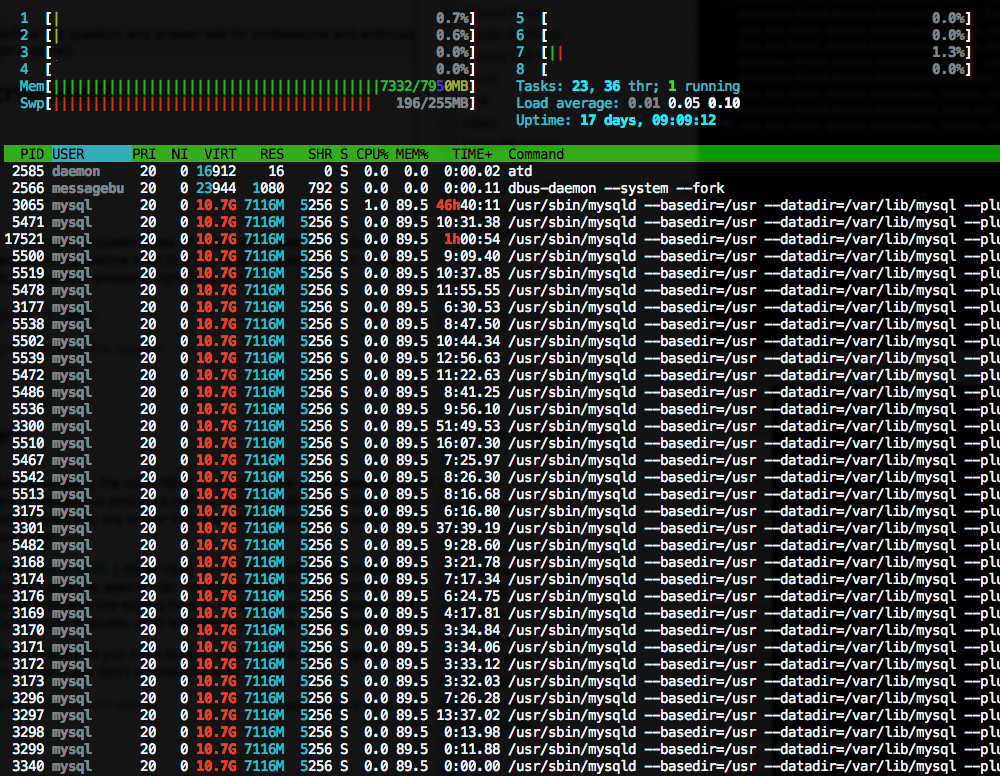
On some web hosts, it could also mean your website is receiving too much concurrent traffic. If you are using a service like Apache as a backend for PHP processing, it’s likely you have limited threading capabilities, limiting the number of concurrent requests your server can accommodate. As a result, requests left waiting to be processed could be kicked out of queue, resulting in a 504 error. If your website receives a lot of concurrent traffic, using a solution like nginx with php-fpm is ideal in that it allows for higher concurrency and faster request processing. Introducing caching layers is another way to help requests process more quickly as well. In this situation, note that 504 errors will likely be intermittent as traffic levels vary up and down on your website.

Last, checking your firewall settings is another good step. If the “upstream” service is rejecting the request or simply not allowing it through, it could result in a networking timeout which causes a 504 error for your users. Note that in this scenario, you would see the 504 error consistently rather than intermittently as with high traffic.

Conclusion

To wrap things up, remember that a 50x error indicates that one service is passing a request “upstream” to another service. This could mean two servers talking to each other, or multiple services within the same server. Using the steps above will hopefully help in guiding you to a solution!

Have you encountered other causes of these errors? Have any feedback, suggestions, or tips? Let me know in the comments below, or contact me.

How the InnoDB Buffer Pool Allocates and Releases Memory

As you may know or have noticed, Memory utilization can be a difficult to truly understand. While tools like free -m can certainly help, they aren’t necessarily a true indication of health or unhealth. For example, if I see 90% Memory utilization, that’s not exactly an indication that it’s time to add more resources. The nature of Memory is to store temporary data for faster access the next time it is needed, and because of this, it tends to hold onto as much temporary data as it can, until it needs to purge something out to make more space.

90% utilization but no swap usage

About the InnoDB Buffer Pool

InnoDB (a table storage engine for MySQL), has a specific pool of Memory allocated to MySQL processes involving InnoDB tables called the InnoDB Buffer Pool. Generally speaking, it’s safest to have an InnoDB Buffer Pool at least the same size as your database(s) on your server environment to ensure all tables can fit into the available Memory.

As queries access various database tables, they are added to Memory in the InnoDB Buffer Pool for faster access by CPU processes. And if the tables being stored in Memory are larger than what is allocated, the tables will be written to swap instead. As I covered in my recent article on Memory and IOWait, that makes for increasingly painful performance issues. 

The InnoDB Buffer Pool is clingy

Yep, that’s right. Like I mentioned above, Memory tends to hold onto the things it’s storing for faster access. That means it doesn’t purge items out of Memory until it actually needs more space to do so. Instead, it uses an algorithm called Least Recently Used (LRU) to identify the least-needed items in cache, and purge that one item out to make room for the next item. So unless your server has simply never had the need to store much in the InnoDB Buffer Pool, it will almost always show high utilization–and that’s not a bad thing! Not unless you are also seeing swap usage. That means something (in my experience, generally MySQL) is overusing its allocated Memory and is being forced to write to disk instead. And if that disk is a rotational disk (SATA/HDD) instead of SSD, that can spiral out of control very easily. 

All this to say, the InnoDB Buffer Pool will hang onto stuff, and that’s because it’s doing its job–storing database tables for faster access the next time they are needed. So don’t take high utilization as a sign of outright unhealth! Be sure to factor swap usage into the equation as well.  

Allocating Memory to the InnoDB Buffer Pool

InnoDB Buffer Pool size and settings are typically configured in your /etc/mysql/my.cnf file. Here you can set variables like:

innodb-buffer-pool-size = 256M
innodb_io_capacity = 3000
innodb_io_capacity_max = 5000

…And more! There’s a whole host of settings you can configure for your InnoDB Buffer Pool in the MySQL documentation. General guidelines for configuring the pool settings: Ensure it’s smaller than the total amount of Memory on your server, and ensure it’s larger or the same size as the database(s) on your server. From there you can perform testing on your website while fine tuning the settings to see which size is most effective for performance. 


Have any comments or questions? Experience to share regarding the InnoDB Buffer Pool? Let me know in the comments, or Contact Me. 

I/O, IOWait, and MySQL

Memory can be a fickle, difficult thing to measure. When it comes to server performance, Memory usage data can be misleading. Processes tend to indicate they are using the full amount of Memory allocated to them when viewing server status in tools like htop. In truth, one of the only health indicators for Memory is swap usage. In this article we will explain swap, Memory usage, IOWait, and common issues with Memory.

Web Server Memory

On a web server, Memory is allocated to the various services on your serve: Apache, Nginx, MySQL, and so on. These processes tend to “hold on” to the memory allocated to them. So much so, it can be nearly impossible to determine how much Memory a process is actively using. On web servers, the files requested by services are in cached Memory (RAM) for easy access. Even when files are not actively being used, the Memory holding the files still looks as though it is being utilized. When a file is always being written or read, it is much faster and efficient for the system to store the file in cached Memory.

Measuring Memory usage with the “free” command

In Linux you can use the free command to easily show how much Memory is being utilized. I like to use the -h flag as well, to more easily read the results. This command will show where your Memory is being utilized: total, free, used, cache, and buffers.

Perhaps most importantly, the free command will indicate whether or not you are writing to swap.

Swap

In a web server environment, when a service over-utilizes the allocated Memory, it will begin to write to swap. This means the web server is writing to disk space as a supplement for Memory. Writing to swap is slow and inefficient, causing the CPU to have to wait while the Memory pages are being written to disk. The most obvious warning flag for Memory concern is swap usage. Writing to swap is a clear indicator that Memory is being overused in some capacity. You can measure swap usage using the free command described above. However, it may be more useful to look at a live monitor of usage like htop instead.

htop will show whether Memory as a whole on a web server is being over-utilized, or whether a specific service is over-utilizing its allocated Memory. A good indicator is to look at the total Memory row compared to the swap row. If Memory is not fully utilized but there is still swap usage, this indicates a single service is abusing Memory.

Why is writing to swap slow?

So why would writing to swap be slow, while writing to Memory (RAM) is not? I think this article sums it up best. But basically, there’s a certain amount of latency involved in rotating the disk to the correct storage point. During this time, the CPU (processor) is idle, making for IOWait.

I/O and IOWait

Any read/write process, including writing and reading pages from Memory, is an I/O process. I/O stands for input/output, but for the purposes of this article you can consider I/O to be read and write operations. Writing and reading pages to and from Memory tends to take a few milliseconds. However, writing and reading from swap is a different story. Because swap is disk space being used instead of Memory, the latency caused by rotating the disk to the correct location to access the correct information adds up to IOWait. IOWait is time the processor (CPU) spends waiting for I/O processes to complete.

IOWait can be problematic on its own, but the problem is compounded by IOPs rate limiting. Some datacenter providers have a low threshold for input/output operations. When the rate of I/O operations increases beyond this limitation, these operations are then throttled. This compounds our IOWait issue, because now the CPU must wait even longer for I/O processes to complete. If the throttling or Memory usage becomes too egregious, your data center might even have a trigger to automatically reboot the server.

MySQL and IOWait

In my experience with WordPress, the service that tends to use the most Memory is MySQL by far. This can be for a number of reasons. When a WordPress query accesses a MySQL database, the tables, rows, and indexes must be stored in Memory. Most modern servers have an allocation of Memory for MySQL called the InnoDB Buffer Pool. If this pool is overutilized, MySQL will begin to store those tables, rows, and indexes to swap instead. A common cause of Memory overutilization is extremely large database tables. If these large tables are used often, they will need to be stored in Memory. If your InnoDB Buffer Pool is smaller than your large table, MySQL will write this data to swap instead.

Most often when troubleshooting Memory issues, I find the cause to be unoptimized databases. By ensuring the proper storage engine and reducing database bloat, many Memory and IOWait issues can be avoided from the start. If your database cannot be optimized further, it’s time to optimize your InnoDB Buffer Pool or server hardware instead. MySQL has a guide to optimizing InnoDB Disk I/O you can use for fine tuning.

Table storage engines

Another common MySQL issue happens when the MyISAM table storage engine is used. MyISAM tables cannot use the InnoDB Buffer Pool as they do not use the InnoDB storage engine. Instead, MyISAM uses a key buffer for storing indexes directly from disk cache. As aforementioned, disk cache is not nearly as performant as Memory. And, reading and writing from disk cache is an I/O operation that can easily cause IOWait.

Beyond the performance implications from not using the InnoDB Buffer Pool, MyISAM is not as ideal for databases on production websites that are frequently writing data to tables. MyISAM will lock an entire table while a write operation is updating or adding a row. This means any other requests or MySQL connections attempting to update the table at the same time might experience errors or delays. By contrast, InnoDB allows row-level locking. With a WordPress website, transients, settings, posts, comments and more data are frequently updating the database. This makes the InnoDB table storage engine much more optimal for WordPress websites.

Partitions and Drives

One way hosting providers have found to avoid IOWait issues is to separate MySQL into its own partition or disk. While this does not necessarily remove the IOWait altogether, it logically separates the partition experiencing IOWait from the web server. This means the partition serving website traffic is not impacted beyond slow query performance in high IOWait conditions. For even faster performance, consider SSD for your MySQL partition. SSD, or Solid State Drives, use non-rotational storage known as “flash.” While the cost per GB of storage space is high with SSDs, they are far more performant in terms of IOPs.


Installing Varnish on Ubuntu

In a few of my posts I’ve talked about the benefits of page cache systems like Varnish. Today we’ll demonstrate how to install it! Before continuing, be aware that this guide assumes you’re using Ubuntu on your server.

Why use Varnish?

Firstly, let’s talk about why page cache is fantastic. For dynamic page generation languages like PHP, the amount of server processing power it takes to build a page compared to serving a static file (like HTML) is substantially more. Since the page has to be rebuilt with each new user to request it, the server does a lot of redundant work. But this also allows for more customization to your users since you can tell the server to build the page differently based on different conditions (geolocation, referrer, device, campaign, etc).

That being said, using persistent page cache is an easy way to get the best of both worlds: cache holds onto a static copy of the page that was generated for a period of time, and then the page can be built as new whenever the cache expires. In short, page cache allows your pages to load in a few milliseconds rather than 1+ full seconds.

Installing Varnish

To install Varnish on a system using Ubuntu, you’ll use the package installer. While logged into your server (as a non-root user), run the following:

sudo apt install varnish

Be sure the Varnish service is stopped while you configure it! You can stop the Varnish service like this:

sudo systemctl stop varnish

Now it’s time to configure the Varnish settings. Make a copy of the default configuration file like so:

cd /etc/varnish
sudo cp default.vcl mycustom.vcl

Make sure Varnish is configured for the right port (we want port 80 by default) and the right file (our mycustom.vcl file):

sudo nano /etc/default/varnish
DAEMON_OPTS="-a :80 \
-T localhost:6082 \
-f /etc/varnish/mycustom.vcl \
-S /etc/varnish/secret \
-s malloc,256m"

Configuring Varnish

The top of your mycustom.vcl file should read like this by default:

backend default {
.host = "127.0.0.1";
.port = "8080";
}

This line defines the “backend,” or which port to which Varnish should pass uncached requests. Now we want to configure the web server to listen on the right port. Nginx will listen on port 8080 by default, but if you’re using Apache you may need to modify the port in your /etc/apache2/ports.conf file and /etc/apache2/sites-enabled/000-default.conf to reference port 8080.

From here you can begin to customize your configuration! You can tell Varnish what requests to add X-Group headers for, which pages to strip out cookies on, how and when to purge the cache, and more. You probably only want to cache GET and HEAD methods for requests, as POST requests should always be uncached. Here’s a basic rule that says to add a header saying not to cache anything that’s not GET and HEAD:

sub vcl_recv {
if (req.request != "GET" && req.request != "HEAD") {
set req.http.X-Pass-Method = req.request;
return (pass);
}
}

And here’s an excerpt which says not to cache anything with the path “wp-admin” (a common need for sites with WordPress):

sub vcl_recv
{
if (req.http.host == "mysite.com" &&
req.url ~ "^/wp-admin")
{
return (pass);
}
}

There’s a ton of other fun custom configurations you can add. To research the available options and experiment with them, check out the book from Varnish.

Once you’ve added in your customizations, be sure to start Varnish:

sudo systemctl start varnish

Now what?

Now you have Varnish installed and configured! Your site will cache pages and purge the cache based on the settings you’ve configured in the mycustom.vcl file. Using cache and caching heavily will heavily benefit your site performance. And, it’ll help your site scale to support more traffic at a time. Enjoy!


Have more questions about Varnish? Confused about how cache works? Any cool cache rules you use in your own environment? Let me know in the comments or contact me.

5 Winning WordPress Search Solutions

The Problem

If you’ve designed many WordPress sites, you may have noticed something: The default search function in WordPress… well… it sucks. It seriously does. If you’re unaware, allow me to enlighten you.

Firstly, the search by default only searches the title, content, and excerpt of default pages and posts on your site. Why does this suck? Because your users probably want to find things that are referenced in Custom Post Types. This includes WooCommerce orders, forums, and anything else you’ve separated to its own specific type of “post.”

The default WordPress search function also doesn’t intuitively understand searches in quotations (“phrase search”), or sort the results by how relevant they are to the term searched.

And, the default WordPress search uses a super ugly query. Here’s the results on my own default search when I searched for the word “tech” on my site:

As a performance expert, this query makes me cringe. These queries are very unoptimized! And they don’t scale well with highly-trafficked sites. Multiple people running searches on your site at once, especially ones with high post counts, will slow your site down to a crawl.

The Solution

So if WordPress search sucks, what is the best option for your site? I’m glad to explain. Firstly, if there’s any way for you to offload the searches to an external service, this will make your site much more “lightweight” on the server. This way, your queries can run on an external service specifically designed for sorting and searching! In this section I’ll explain some of the best options I’ve seen.

Algolia Search

Algolia is a third party integration you can use with WordPress. With this system, your searches happen “offsite,” on Algolia’s servers. It returns your results lightning fast. Here’s a comparison of using WordPress default search, to Algolia’s external query system, on a site with thousands of events:

Default WP search:

Algolia search:

Algolia clearly takes the cake here, returning results in .5 seconds compared to nearly 8 seconds. Not only is it fast, offloading searches to external servers optimized for query performance helps reduce the amount of work your server has to do to serve your pages. This means your site will support more concurrent traffic and more concurrent searches!

Lift: Search for WordPress

The Lift plugin offers similar benefits to Algolia in that it offers an offsite option for searching. This plugin specifically uses Amazon CloudSearch services to support your offsite searches. The major downside to this plugin is that it hasn’t been actively maintained: it hasn’t been updated in over two years. Here’s a cool diagram of how it works:

source: colorlib.com

While this plugin hasn’t been updated in quite a while, it works seamlessly with most plugins and themes, offers its own search widget, and can even search media uploads. WP Beginner has a great setup guide for help getting started.

ElasticPress

ElasticPress is a WordPress plugin which drastically improves searches by building massive indexes of your content. Not only does it integrate well with other post types, it allows for faster and more efficient searches to display related content. This plugin requires you to have ElasticSearch installed on a host. This can be the server your site resides on (if your host allows), your own computer, a separate set of servers, or using Elastic Cloud to host it on AWS using ElasticSearch’s own service. To manage your indexes, you’ll want to use WP CLI.

ElasticPress can sometimes be nebulous to set up, depending on your configuration and where ElasticSearch is actually installed. But the performance benefits are well worth the trouble. According to pressjitsu, “An orders list page that took as much as 80 seconds to load loaded in under 4 seconds” – and that’s just one example! This system can take massive, ugly search queries and crunch them in a far more performant environment geared specifically towards searching.

Other options

There are some other free, on-server options for search plugins. These plugins will offer more options for searching intuitively, but will not offer the performance benefits of the ones mentioned above.

Relevanssi

Relevanssi is what some in the business call a “Freemium” plugin. The base plugin is free, but has premium upgrades that can be purchased. Out of the box, the free features include:

  • Searching with quotes for “exact phrases” – this is how many search engines (like Google) search, so this is an intuitive win for your users.
  • Indexes custom post types – a big win for searching your products or other
  • “Fuzzy search” – this means if users type part of a word, or end up searching with a typo, the search results still bring up relevant items.
  • Highlights the search term(s) in the content returned – this is a win because it shows customers why specific content came up for their search term, and helps them determine if the result is what they need.
  • Shows results based on how relevant or closely matched they are, rather than just how recently they were published.

The premium version of Relevanssi includes:

  • Multisite support
  • Assign “weight” to posts so “heavier” ones show up more or higher in results
  • Ability to import/export settings

Why I don’t recommend Relevanssi at the top of my list: it’s made to be used with 10,000 posts or less. The more posts you have, the less performant it is. This is because it still uses MySQL to search in your site’s own database, which can weigh down your site and the server it resides on. Still, it offers more options for searching than many! It is a viable option if you have low traffic and fewer than 10,000 posts.

SearchWP

SearchWP claims to be the best search plugin out there. It certainly offers a lot of features, either way. Out of the box, it can search: PDFs, products and their description, shortcode data, terms and taxonomy data, and custom field data. That’s a pretty comprehensive list!

Above you can see some of the nice customizable settings like weight, excluding options, custom fields, and how to easily check/uncheck items to include.

However, SearchWP comes with a BIG asterisk from me. SearchWP will create giant tables in your database. Your database should be trim to perform well. You want to be sure the size of your databases fit within your Memory buffer pool for MySQL processes to ensure proper performance. Be absolutely certain you have enough server resources to support the amount of data stored by SearchWP!


These solutions are the only ones I would truly recommend for sites. There certainly are others available, but they work using AJAX which can easily overwhelm your server and slow down your site. Or, they use equally ugly queries to find the search terms.

As a rule of thumb, I absolutely recommend an offsite option specifically optimized for searches. If this simply isn’t an option, be sure to use a plugin solution that offers the range of features you need without weighing down your database too much.

Is there a search solution you like on your own site? Is there an important option I left off? Let me know in the comments, or contact me.


Troubleshooting High Server Load

Why does server load matter?

High server load is an issue that can affect any website. Some symptoms of high server load include: slow performance, site errors, and sometimes even site down responses. Troubleshooting high server load requires SSH access to the server where your site resides.

What is high server load?

First, you’ll want to find out: is my server’s load high? Server load is relative to the amount of CPU cores on said server. If your server has 4 cores, a load of “4” means you’re utilizing 100% available CPU. So first, you’ll want to find out how many cores your server has.

nproc – This command says to simply print the number of CPU cores. Quick and easy!

$ nproc
8

htop – This command will bring up a live monitor of your server’s resources and active processes. The htop command will show you a lot of information, including the number of cores on your server. The numbered rows are the CPU cores:

Now that we know how many CPU cores are on the server, we can find out: what is the load? There’s a few methods to find out:

uptime – This command will simply print what the current load is, the date and time, and how long the server has gone without rebooting. The numbers after “load average” indicates your server’s load average for the past minute, five minutes, and fifteen minutes respectively.

$ uptime
17:46:44 up 19 days, 15:25, 1 user, load average: 1.19, 1.01, 1.09

sar -q – This command will not only show you the current load for the last one, five, and fifteen minutes. It will show you the output of this command for every five minutes on the server since the beginning of the day.

htop – Just like finding the number of cores, htop will show you how many of the cores are being utilized (visually), and print the load average for the past one, five, and fifteen minutes.

With just this information, I can see that the server example given does not have high server load. The load average has been between 1-2 today, and my server has 8 cores. So we’re seeing about a 25% max load on this server.

My server’s load is high! What now?

If you’ve used the above steps to identify high CPU load on your server, it’s time to find out why the load is high. The best place to start is again, htop. Look in the output below the number of cores and load average. This will show you the processes on your server, sorted by the percentage of CPU they’re using. Here’s an example:

In this example we can see that there’s a long list of apache threads open! So much so, the server’s load is nearly 100. One of the key traits with Apache is knowing that each concurrent request on your website will open a new Apache thread, which uses more CPU and Memory. You can check out my blog post on Nginx vs Apache for more details on the architecture. In short, this means too many Apache threads are open at once.

So let’s see what’s currently running in Apache!

High load from Apache processes

lynx server-status – When using the Lynx you can see a plain text view of a webpage. This might not sound all that useful, but in the case of server load, there’s a module called mod_status that you can monitor with this. For a full breakdown, check out Tecmint’s overview of apache web server statistics.

lynx http://localhost:6789/server-status

If you’re checking this on your server, be sure to route the request to the port where Apache is running (in my case it’s 6789). Look at the output to see if there are any patterns – are there any of the same kind of request repeated? Is there a specific site or VHost making the most requests?

Once you’ve taken a look at what’s currently running, it’ll give you an idea of how to best search your access logs. Here’s some helpful access-log searching commands if you’re using the standard Apache-formatted logs:

Find the largest access log file for today (identify a site that’s hitting Apache hard):

ls -laSh /var/log/apache2/*.access.log | head -20 | awk '{ print $5,$(NF) }' | sed -e "s_/var/log/apache2/__" -e "s_.access.log__" | column -t

(be sure to change out the path for the real path to your access logs – check out the list of access log locations for more help finding your logs).

Find the top requests to Apache on a specific site (change out the log path with the info from the link above if needed):

cut -d' ' -f7 /var/log/apache2/SITENAME.access.log | sort | uniq -c | sort -rn | head -20

Find the top user-agents hitting your site:

cut -d'"' -f6 /var/log/apache2/SITENAME.apachestyle.log | sort | uniq -c | sort -rn | head -20

Find the top IP addresses hitting your site:

cut -d' ' -f1 /var/log/apache2/SITENAME.apachestyle.log | sort | uniq -c | sort -rn | head -25 | column -t

High load from MySQL

The other most common offender for high load and high Memory usage is MySQL. If sites on your server are running a large number of queries to MySQL at the same time, it could cause high Memory usage on the server. If MySQL uses more Memory than it’s allotted, it will begin to write to swap, which is an I/O process. Eventually, servers will begin to throttle the I/O processes, causing the processes waiting on those queries to stall. This adds even more CPU load, until the server load is destructively high and the server needs to be rebooted. Check out the InnoDB vs MyISAM section of my blog post for more information on this.

In the above example, you can see the Memory being over utilized by MySQL – the bottom left column at the top indicates swap usage. The server is using so much swap it’s almost maxed out! If you’re running htop and notice the highest user of CPU is a mysql process, it’s time to bring out mytop to monitor the active queries being run.

mytop – This is an active query monitor tool. Often times you’ll need to run this command with sudo, for reference. Check out Digital Ocean’s documentation to get mytop up and running.

This can help you track down what queries are slow, and where they’re coming from. Maybe it’s a plugin or theme on your site, or a daily cron job. In the example above, crons were responsible for the long queries to the “asterisk” database.

Other causes of high load

On top of Apache and MySQL, there’s definitely other causes of poor performance. Always start with htop to identify the bad actors causing high load. It might be server-level crons running, sleep-state processes waiting too long to complete, writing to logs, or any number of things. From there you can narrow your search until you’ve identified the cause, so you can work towards a solution!

While there can be many causes of high server load, I hope this article has been helpful to identify a few key ways to troubleshoot the top offenders. Have any input or other advice when troubleshooting high server load? Let me know in the comments, or contact me.


  • Page 1
  • Page 2
  • Page 3
  • Next Page »

Footer

Categories

  • Ansible
  • AWS
  • Git
  • Linux
  • Optimization
  • Performance
  • PHP
  • Scalability
  • Security
  • Uncategorized
  • WordPress

Copyright © 2025 · Atmosphere Pro on Genesis Framework · WordPress · Log in